By Collins Odhiambo Owino
Founder & Lead Analyst — DatalytIQs Academy
Source: Finance & Economics Dataset (2000–2025)-Kaggle, DatalytIQs Academy Research Repository.
Overview
The interplay between GDP growth, inflation, and unemployment lies at the heart of macroeconomic stability.
Economists, policymakers, and investors alike track these indicators to assess whether an economy is expanding efficiently, overheating, or stagnating.
Using the Finance & Economics Dataset (2000–2008), this analysis visualizes and interprets the dynamic relationships among these three variables — revealing how growth, prices, and labor conditions evolve together over time.

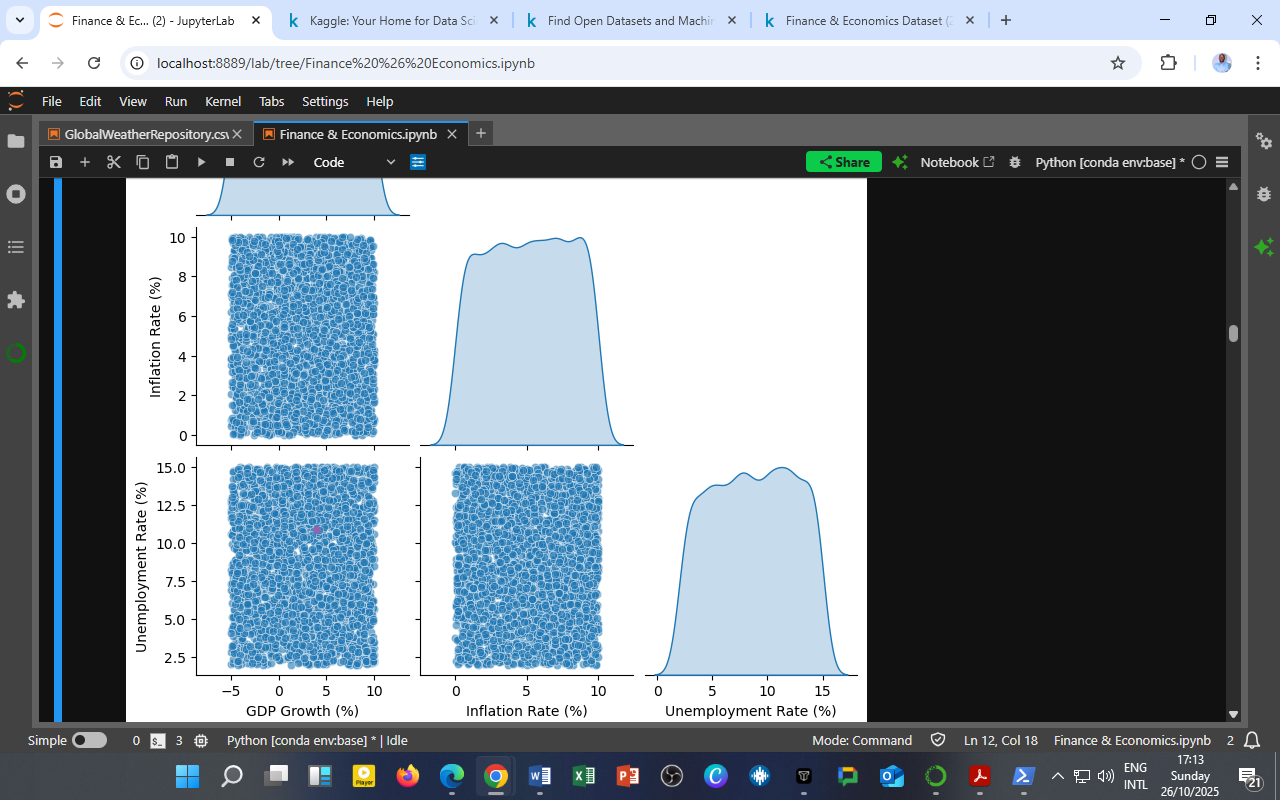
The Scatter Matrix: Macroeconomic Relationships chart (shown above) summarizes these interactions through a combination of distribution plots and scatter relationships.
The Visualization Explained
Each panel of the scatter matrix serves a unique purpose:
-
Diagonal panels show kernel density estimates (KDEs) — the smoothed probability distributions for each variable.
-
Off-diagonal panels display pairwise scatterplots — showing how each variable behaves relative to the others.
Together, they offer both a micro view of individual behavior and a macro view of interdependence.
Observations and Interpretations
A. GDP Growth (%) Distribution
-
The GDP curve displays bimodality, indicating alternating phases of expansion and mild contraction.
-
This pattern reflects economic cycles — where growth is driven by investment booms followed by cooling phases due to external shocks or policy tightening.
-
The clustering around moderate positive growth suggests a resilient yet cyclical economy.
B. Inflation Rate (%) Distribution
-
Inflation is nearly uniform between 0–10%, meaning most values fall within a stable range.
-
This uniformity suggests price stability, possibly maintained through sound monetary policy, central bank independence, and careful management of money supply.
-
The absence of extreme inflation or deflation underscores a controlled macroeconomic environment.
C. Unemployment Rate (%) Distribution
-
The unemployment curve is slightly right-skewed, peaking around 5–12%.
-
This points to persistent structural unemployment — where joblessness is not solely cyclical but influenced by skills gaps, technology shifts, or labor market inefficiencies.
-
Despite fluctuations, the overall trend implies a relatively stable but moderately high unemployment regime.
D. Pairwise Scatter Relationships
-
GDP vs. Inflation
The scatter appears widely dispersed, confirming a weak correlation (–0.02). Economic output and prices moved largely independently during this period.
Growth did not consistently trigger inflationary pressure, implying effective macroprudential management. -
GDP vs. Unemployment
The scatter shows no clear downward trend, challenging the traditional Okun’s Law relationship.
Economic growth was not strongly linked to job creation — possibly due to automation, informal employment, or delayed labor market responses. -
Inflation vs. Unemployment
The distribution remains diffuse, indicating a weak Phillips Curve effect (r ≈ –0.03).
Inflation and unemployment were not directly trade-offs; inflation control did not necessarily raise joblessness.
Analytical Summary
| Indicator | Average Behavior | Economic Interpretation |
|---|---|---|
| GDP Growth | Alternating cycles around moderate positive growth | Reflects a cyclical but resilient economy |
| Inflation | Stable, mostly between 2–7% | Indicates effective monetary management |
| Unemployment | Concentrated between 5–12% | Suggests frictional and structural labor challenges |
| Correlations | Weak across all pairs | Highlights policy-induced stabilization and lag effects |
Why It Matters
-
For Policymakers:
The weak direct linkages emphasize the importance of multi-dimensional policy design. Fiscal, monetary, and labor reforms must work together rather than in isolation. -
For Economists and Researchers:
These visual patterns encourage the use of advanced econometric techniques (e.g., VAR, ARIMA, PCA) to uncover lagged or non-linear relationships invisible in static correlation plots. -
For Investors and Market Analysts:
Stability in inflation and unemployment despite GDP shifts indicates predictable macroeconomic conditions — an environment favorable for medium-term investment planning.
The DatalytIQs Academy Perspective
At DatalytIQs Academy, this type of analysis bridges theory and data.
By combining visual analytics and statistical modeling, learners and professionals gain real-world insight into how economies behave under varying growth, inflation, and labor pressures.
This analytical approach is part of our mission to empower decision-makers through data-driven economics education.
Citation and Attribution
Author: Collins Odhiambo Owino
Institution: DatalytIQs Academy
Dataset: Finance & Economics Dataset (2000–2025),Kaggle.
Source: Compiled and curated by DatalytIQs Academy Research Repository from global financial and macroeconomic databases (2025).
Leave a Reply
You must be logged in to post a comment.