
How Company Response Behavior Shapes Consumer Experience
Insights From 3,600+ Performance Records In today’s digital financial ecosystem, customers expect swift, fair, and transparent responses when problems arise. Whether it’s a loan dispute,
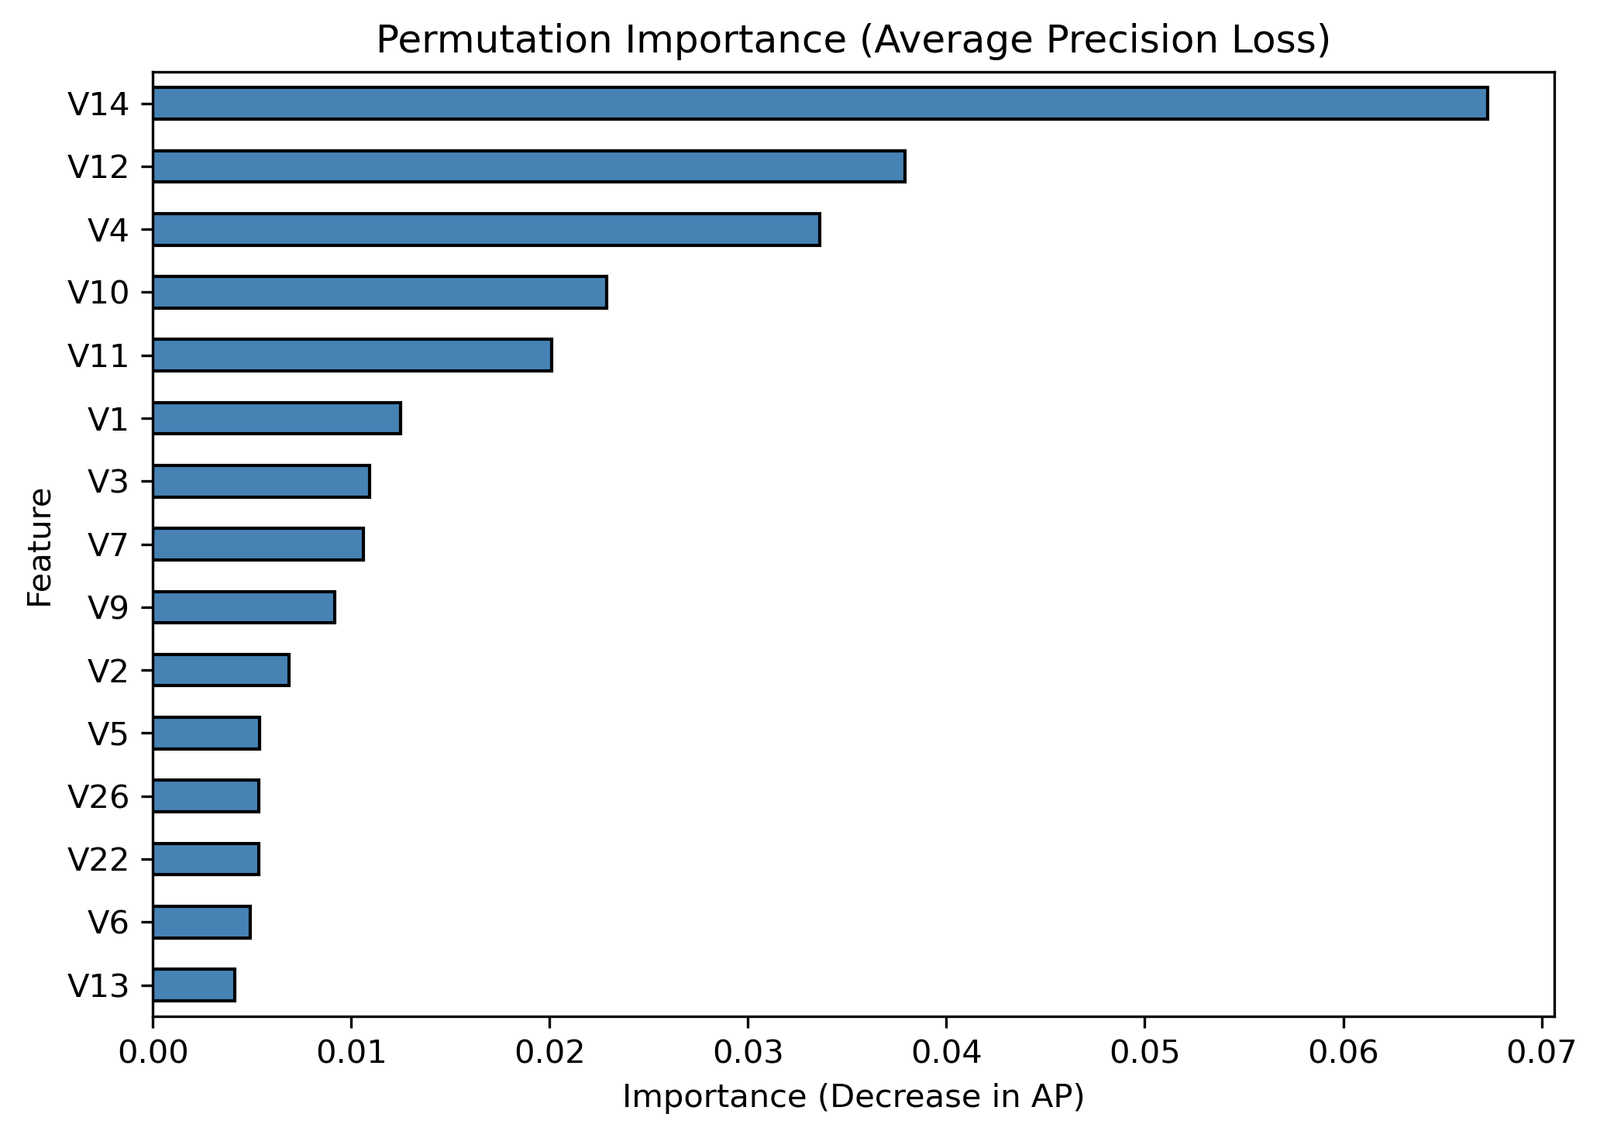
Behind Every Fraud Lies a Pattern , and V14 Knows It
Interpretation of the Permutation Importance Results 1. Dominant Predictors V14, V12, and V4 are the top three features with the highest importance. V14 (AP decrease
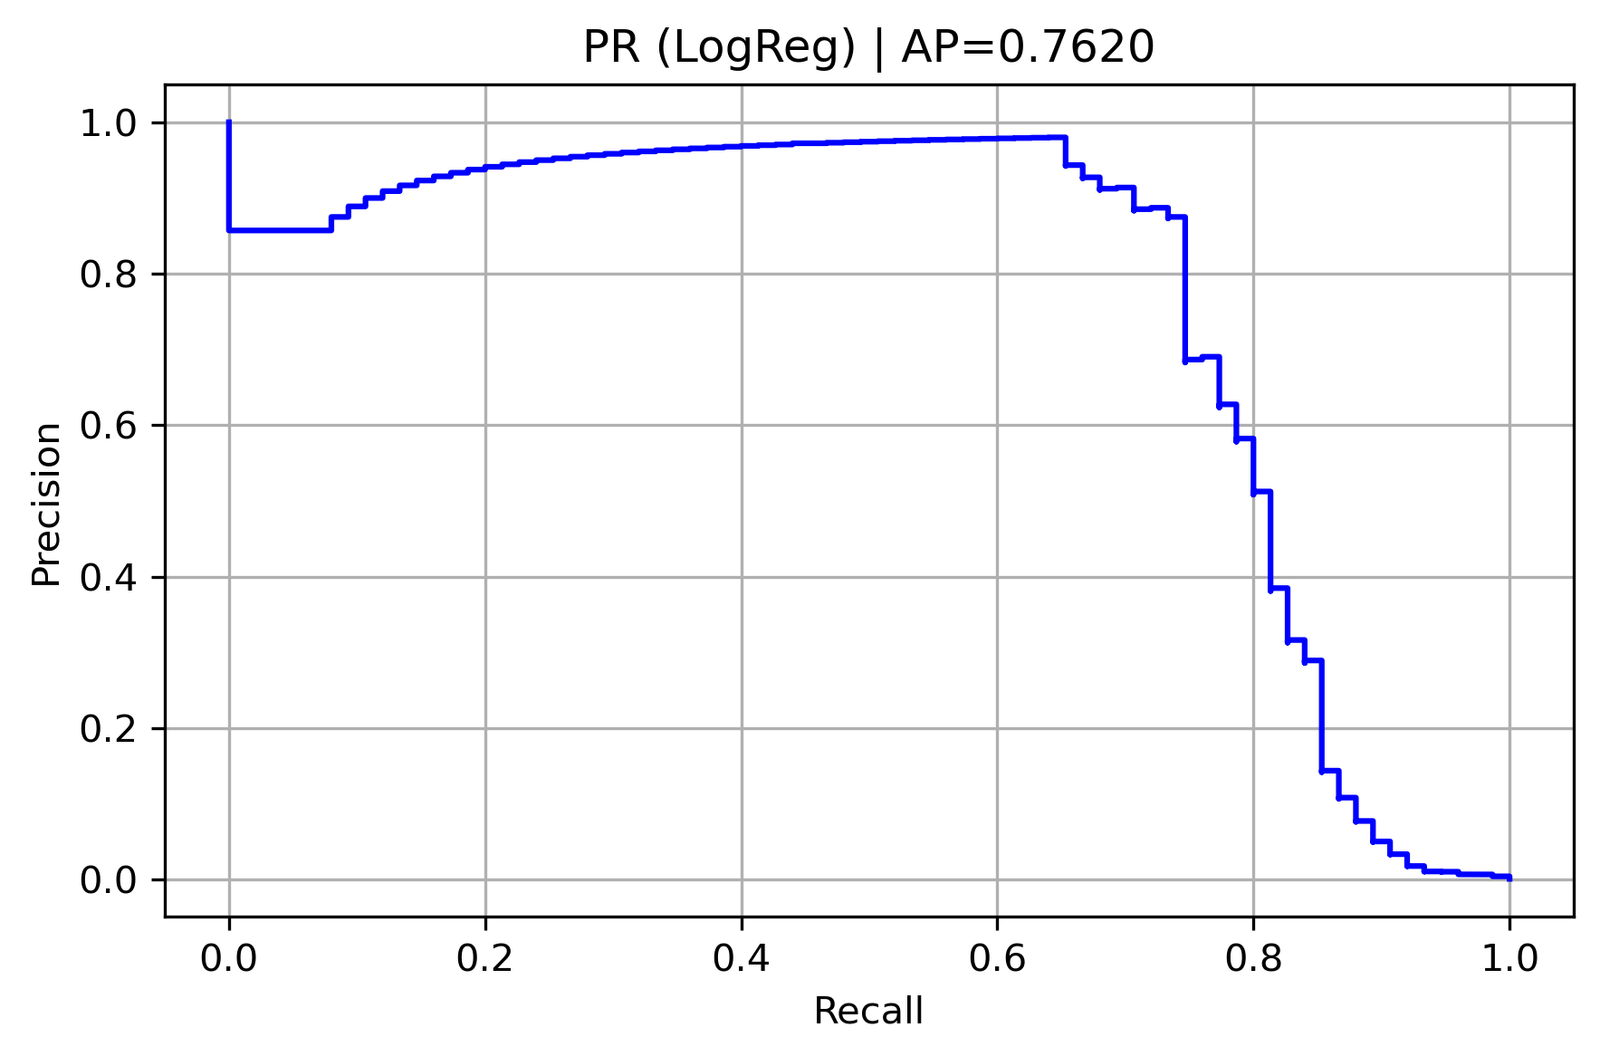
How Machine Learning Is Transforming Credit Card Fraud Prevention
Background Credit card fraud remains one of the fastest-evolving financial crimes, costing global institutions billions of dollars annually. Traditional rule-based systems often struggle to keep
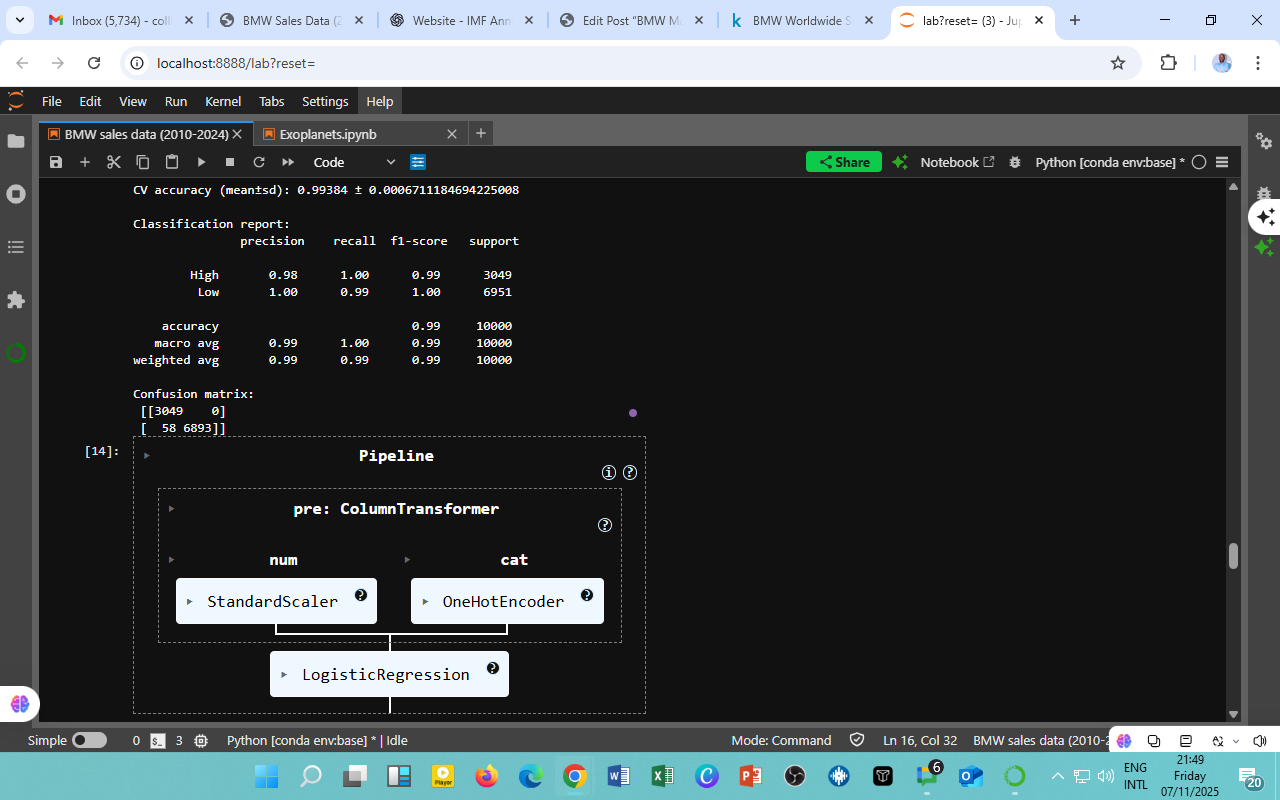
Predicting BMW Sales Classification (2010–2024) Using Logistic Regression
Overview To understand which vehicle attributes most influence whether BMW sales fall into high or low performance categories, a Logistic Regression classifier was trained on
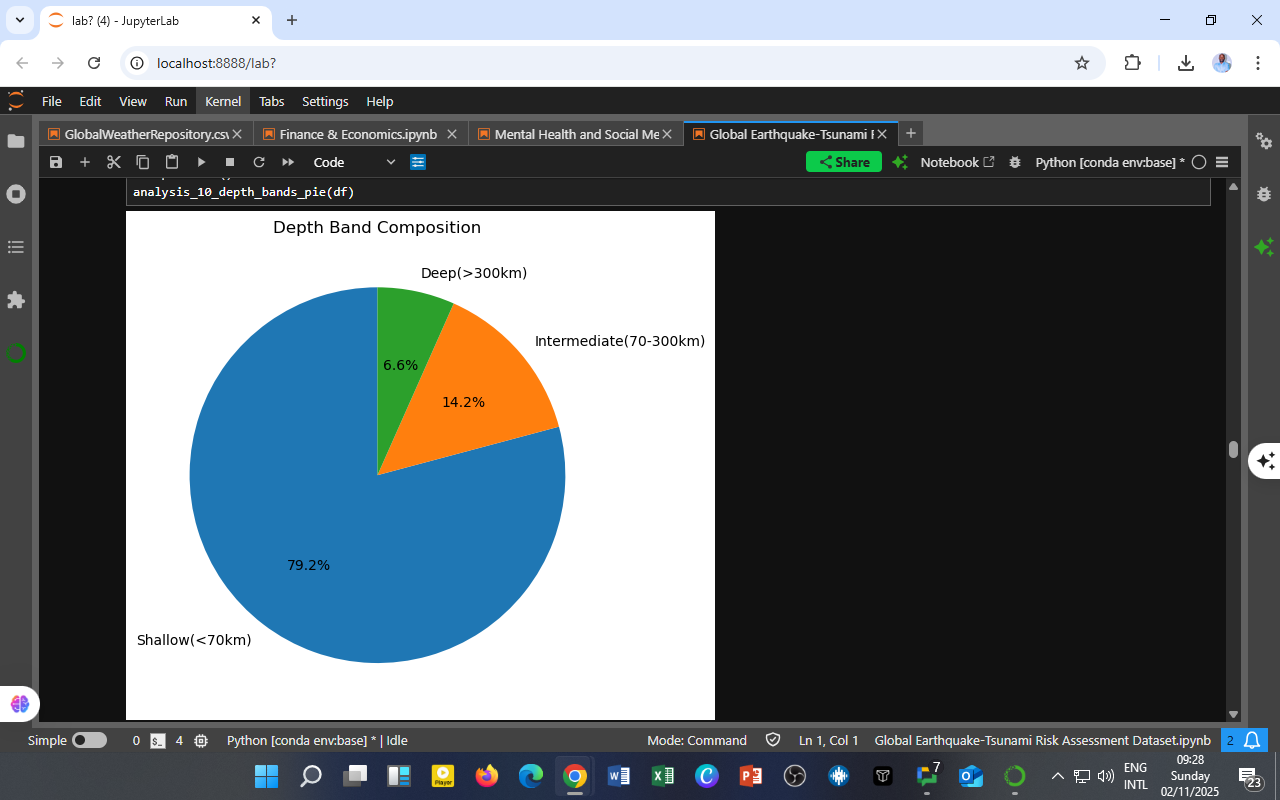
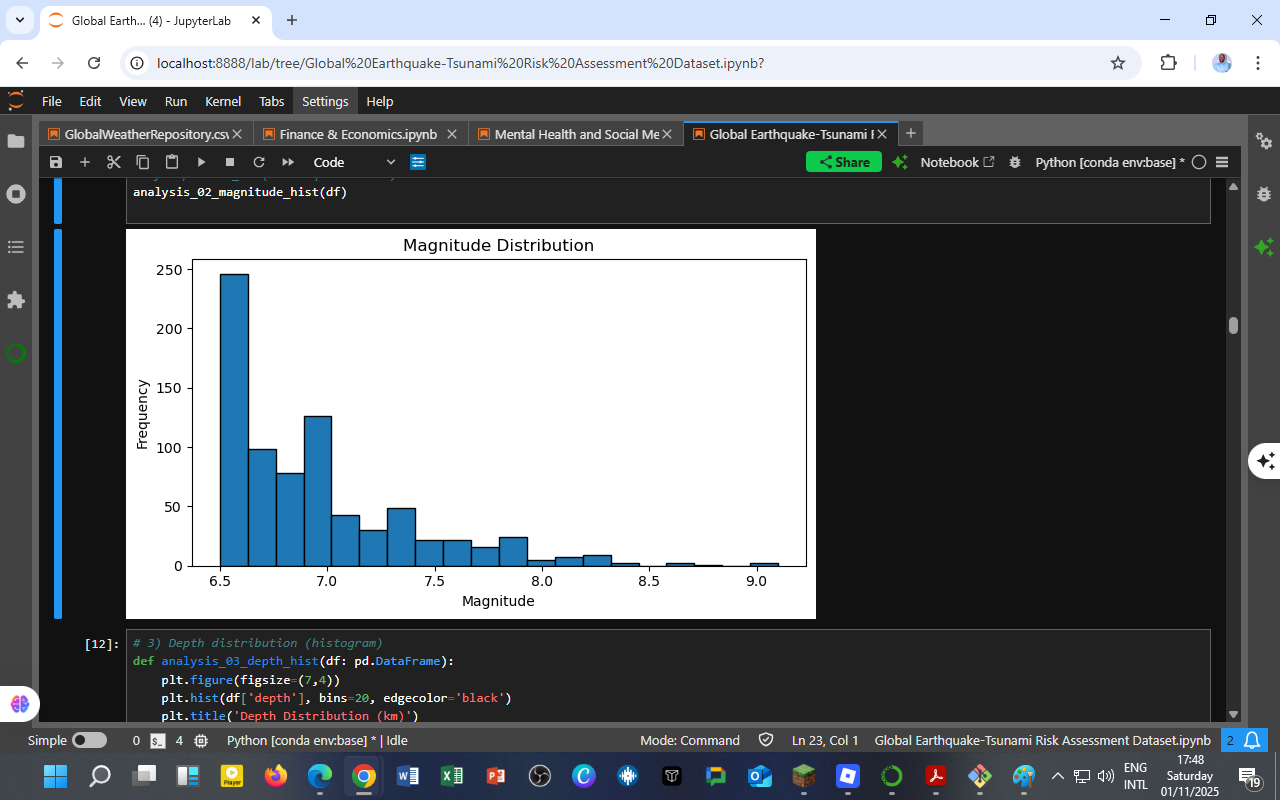
Depth Band Composition of Global Earthquakes (2001–2022)
Insights from the Global Earthquake–Tsunami Risk Assessment Dataset Overview The depth of an earthquake’s focus is the point within the Earth where seismic energy is
Global Earthquake–Tsunami Risk Assessment Dataset
Seismic Features, Temporal Trends, and Global Distribution Analysis (2001–2022) Overview The Global Earthquake–Tsunami Risk Assessment Dataset is a comprehensive, machine learning–ready dataset that records 782
Global Earthquake–Tsunami Risk Assessment Dataset
Seismic Features, Temporal Trends, and Global Distribution Analysis (2001–2022) Overview The Global Earthquake–Tsunami Risk Assessment Dataset is a comprehensive, machine learning–ready seismic database designed for
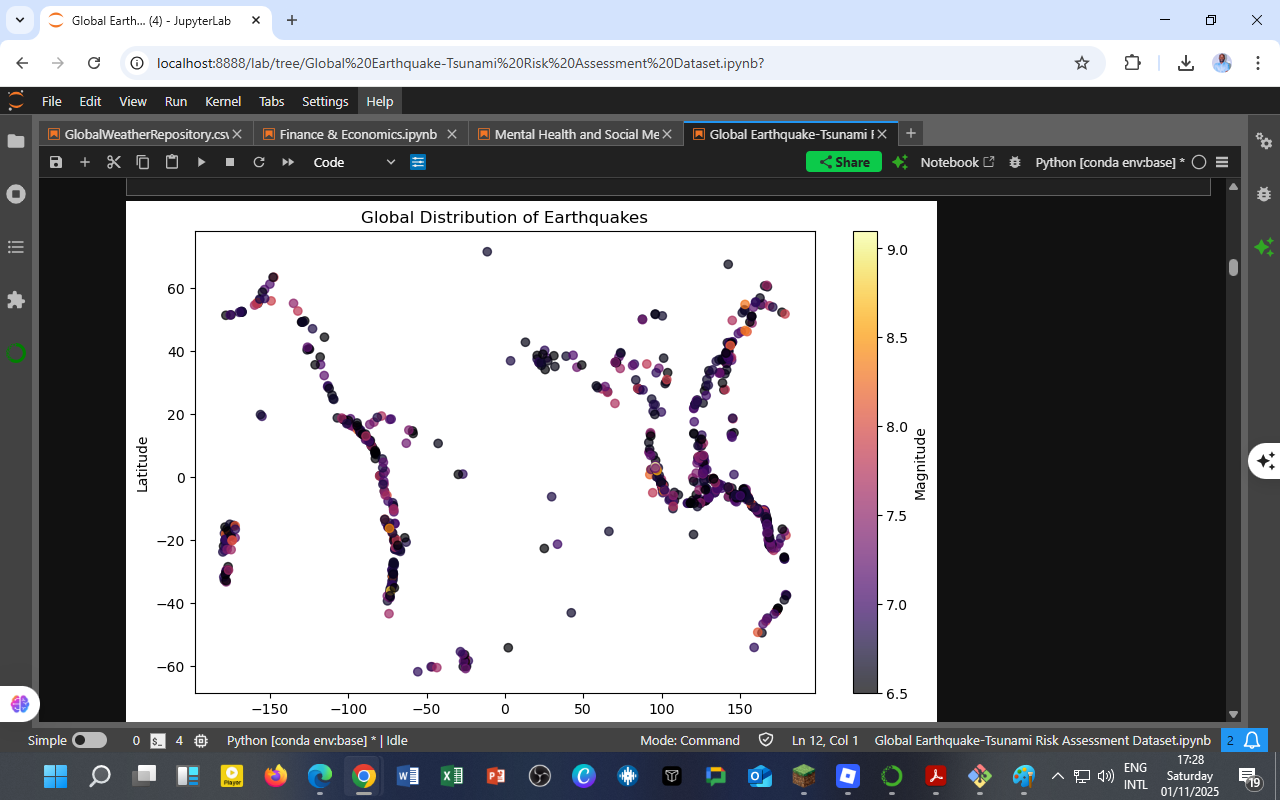
Global Earthquake–Tsunami Risk Assessment Dataset
Seismic Features, Temporal Trends, and Global Distribution Analysis (2001–2022) Overview The Global Earthquake–Tsunami Risk Assessment Dataset is a comprehensive, machine learning–ready dataset covering 782 significant
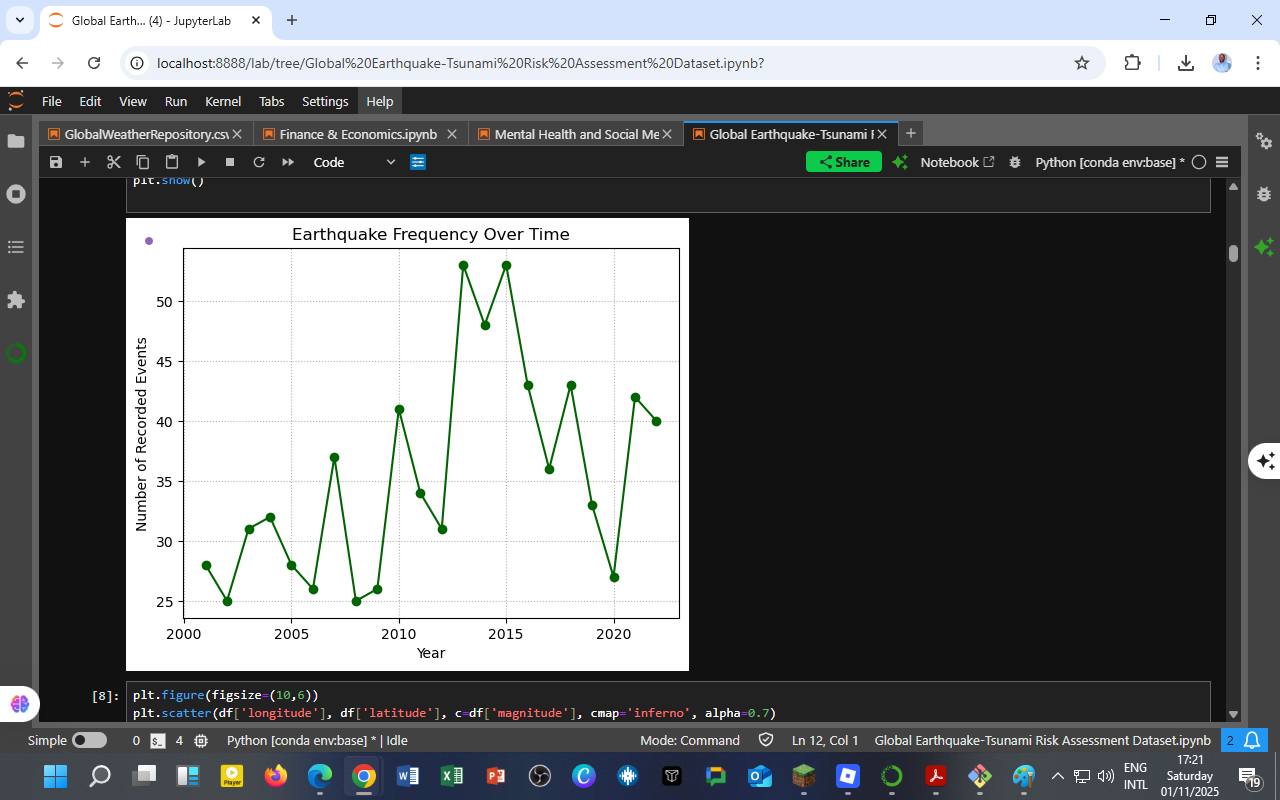
Earthquake Frequency Over Time (2001–2022)
Overview The line graph above illustrates the annual frequency of recorded earthquakes with magnitudes ≥6.5 on the Richter scale over 22 years (2001–2022). Each point
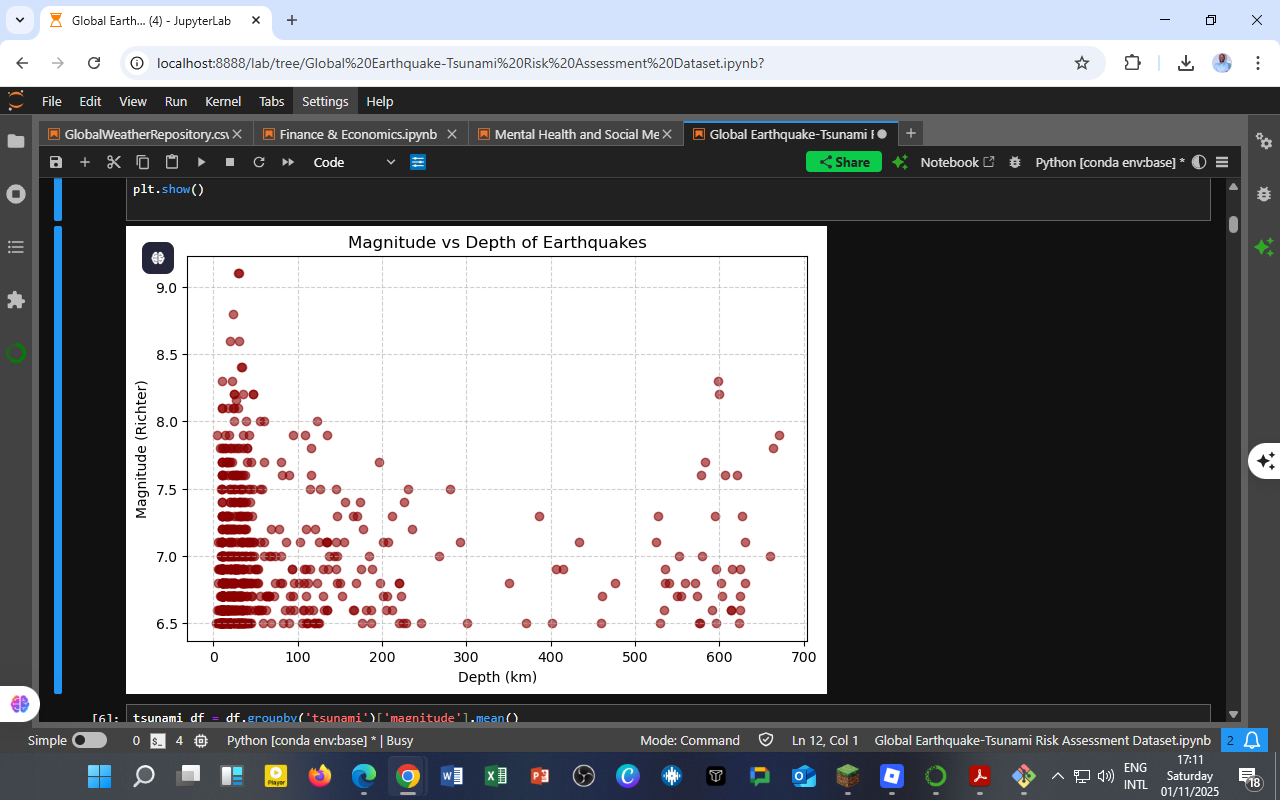
Exploring the Relationship Between Earthquake Magnitude and Depth
https://www.youtube.com/live/exTDo4AFdsM?si=pIr32Dr66bbZZtbg Visual Insight The figure above shows a scatter plot of Magnitude vs Depth of Earthquakes, part of a broader global earthquake–tsunami risk assessment study.

You must be logged in to post a comment.