Why Services Matter
While goods prices have eased worldwide, services inflation—covering rent, transport, health, hospitality, and education—remains stubbornly high.
Services are labor-intensive and slow to respond to monetary policy, making them the last mile of global disinflation.
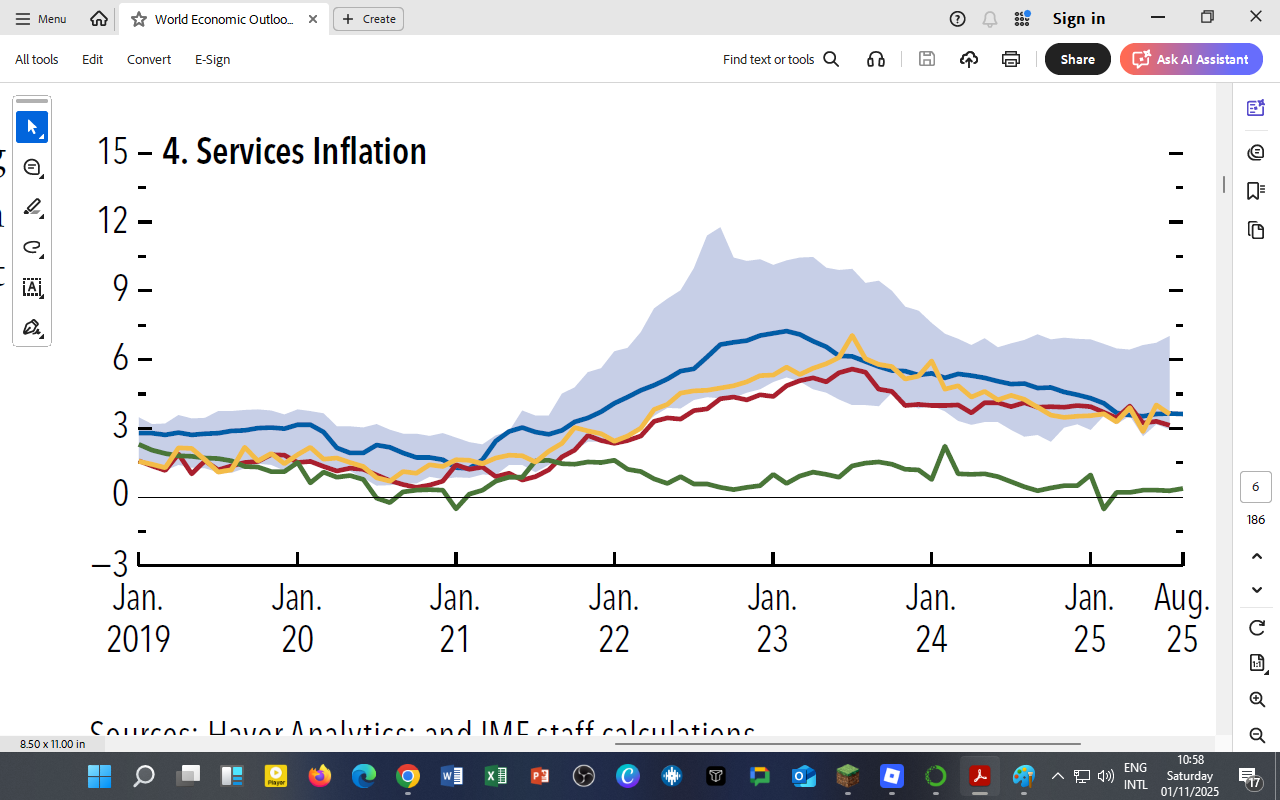
Figure 1.6 (4) — Services Inflation Trends (2019 – 2025)

Key Regions:
-
United States (blue)
-
Euro Area (red)
-
Other Advanced Economies (gold)
-
China (green)
-
Other Emerging and Developing Economies (EMDEs) – blue-shaded band
Global Patterns and Persistence
1. Gradual Rise (2020 – 2022):
As pandemic restrictions lifted, global demand for travel, housing, and leisure surged. Tight labor markets lifted wages, pushing up prices in core services sectors.
2. Sticky Plateau (2023 – 2025):
Unlike goods inflation, services inflation declined only slowly.
-
U.S. and Euro Area hover around 3–4 %.
-
Other AEs mirror similar patterns as wage negotiations catch up with living costs.
-
China remains below 1 %, reflecting weaker consumption.
-
EMDEs show the widest variability (3–9 %), dominated by transport and education costs.
Services inflation has replaced food and energy as the main obstacle to achieving 2 % inflation targets.
Why Services Inflation Is So Sticky
| Structural Factor | Description | Effect on Prices |
|---|---|---|
| Labor Intensity | Wages are 60–80 % of service-sector costs. | Rising wages sustain inflation even as input prices fall. |
| Limited Tradeability | Most services cannot be imported cheaply. | Domestic cost pressures remain local. |
| Housing Shortages | Tight rental markets across cities. | Persistent shelter inflation. |
| Health & Education | High demand post-pandemic. | Structural inflation above target. |
Central banks face a slow transmission of rate hikes to service prices because of multi-year contracts and labor agreements.
Regional Reflections — Africa and Kenya
-
Kenya’s services inflation averages ≈ 4 %, driven by transport and housing.
-
Public transport fare adjustments and energy pass-through effects mirror global pressures.
-
Growing demand for private education and healthcare adds to non-tradable inflation.
-
CBK’s 9.25 % policy rate anchors expectations but cannot fully offset domestic structural drivers.
Service-sector inflation demonstrates why macroeconomic stability depends on supply-side policy — urban housing, skills development, and productivity reforms.
For DatalytIQs Academy Learners
-
Recreate this chart using Python’s
fill_between()for the EMDE band. -
Compare core goods vs services inflation to illustrate post-pandemic divergence.
-
Conduct a correlation analysis between Kenya’s services inflation and global indices.
-
Simulate policy scenarios showing how interest rates affect service prices over 12–18 months.
Data and Acknowledgment
Source: IMF World Economic Outlook (October 2025) – Figure 1.6 (4) “Services Inflation.”
Acknowledgment: Haver Analytics and IMF staff for data and visual insights.
Author: Collins Odhiambo Owino, DatalytIQs Academ
Leave a Reply
You must be logged in to post a comment.