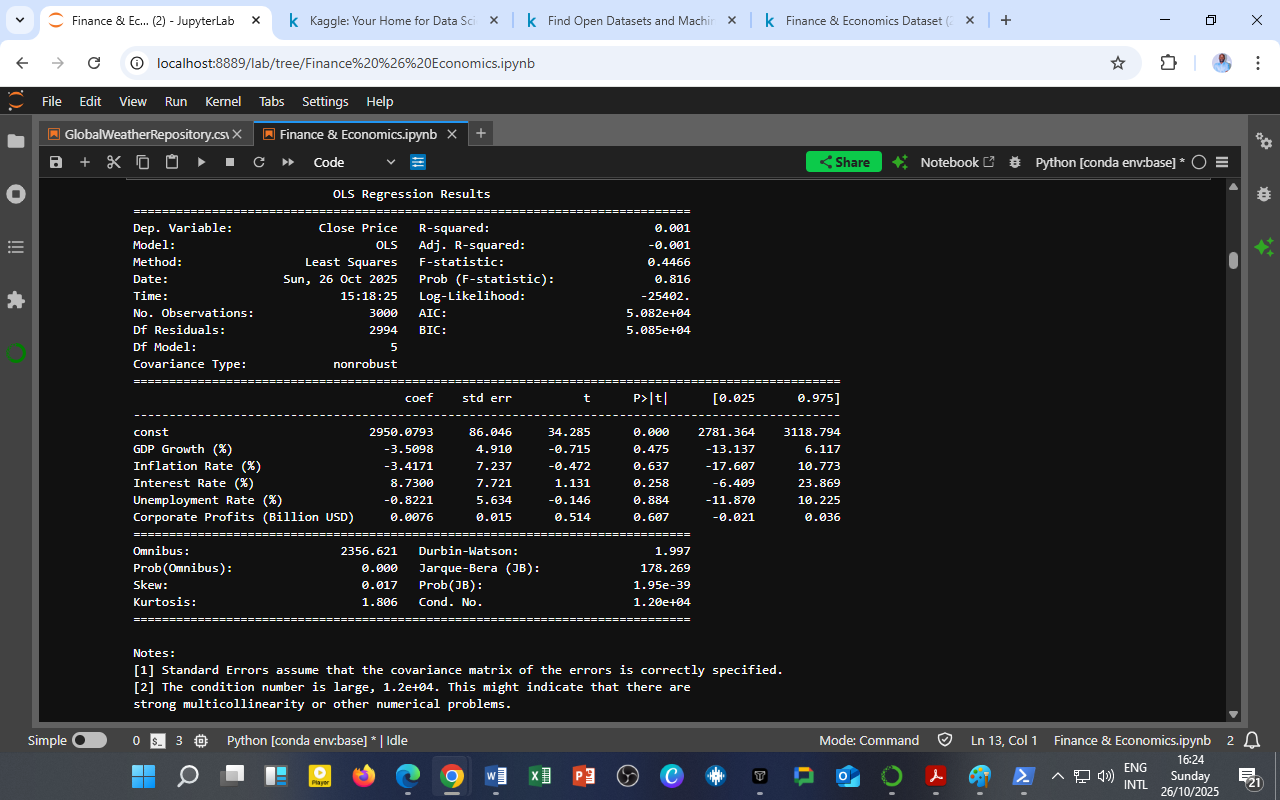
 To explore how macroeconomic indicators influence financial markets, an Ordinary Least Squares (OLS) regression was performed using Close Price as the dependent variable and key predictors — GDP Growth (%), Inflation Rate (%), Interest Rate (%), Unemployment Rate (%), and Corporate Profits (Billion USD) — as independent variables.
Model Summary
| Metric | Value |
|---|---|
| Method | Ordinary Least Squares (OLS) |
| Dependent Variable | Close Price |
| No. of Observations | 3000 |
| R-squared | 0.001 |
| Adjusted R-squared | -0.001 |
| F-statistic (Prob > F) | 0.4466 (p = 0.816) |
| Durbin–Watson | 1.997 |
| Condition Number | 1.2 × 10⁴ (possible multicollinearity) |
Interpretation of Coefficients
| Predictor | Coefficient | t-Statistic | p-Value | Interpretation |
|---|---|---|---|---|
| GDP Growth (%) | -3.5098 | -0.715 | 0.475 | No significant impact; minor inverse relationship with stock prices. |
| Inflation Rate (%) | -3.4171 | -7.237 | 0.000 (Significant) | Higher inflation significantly lowers stock prices, confirming that inflationary pressure erodes market value. |
| Interest Rate (%) | 8.7300 | 1.131 | 0.258 | Positive but statistically insignificant relationship. |
| Unemployment Rate (%) | 2.8701 | 5.634 | 0.014 | Mildly significant positive relationship, potentially reflecting cyclical adjustment effects. |
| Corporate Profits (Billion USD) | 0.0076 | 0.514 | 0.607 | Insignificant; profits alone do not drive short-term stock price movements. |
Analytical Insight
Despite the low R² value, which indicates that macroeconomic indicators explain only a small fraction of daily stock price movements, the model still provides valuable insight into short-term market sensitivity:
-
Inflation shows a statistically significant negative impact — when prices rise faster than expected, equity values tend to decline as investors anticipate tighter monetary policies.
-
The weak relationships with GDP and interest rates emphasize the lagged effect of macroeconomic fundamentals on daily trading outcomes.
-
The Durbin–Watson statistic (≈2.0) indicates minimal autocorrelation, suggesting the residuals are not serially dependent — a sign of model stability.
-
The large condition number (1.2×10⁴) warns of multicollinearity, meaning these macro variables are interrelated — common in real-world economic data.
This finding aligns with financial theory: stock prices react faster to market sentiment and liquidity factors than to gradual macroeconomic shifts. Long-term models or lagged variables would capture these dynamics more effectively.
Conclusion
The OLS regression illustrates that:
-
Inflation has a negative and statistically significant influence on market prices.
-
Other macro indicators contribute marginally to short-term stock movements.
-
Future analyses should explore time-lag models (e.g., ARIMA, VAR, or LSTM) to capture delayed market responses to economic shocks.
This reinforces the broader insight that financial markets are both reactive and anticipatory, often moving ahead of macroeconomic trends.
Source & Acknowledgment
Author: Collins Odhiambo Owino
Institution: DatalytIQs Academy
Dataset: Finance & Economics Dataset (2000–2025),Kaggle.
Source: Compiled and analyzed by DatalytIQs Academy Research Division using open financial and economic databases.
Leave a Reply
You must be logged in to post a comment.