
Source: Finance & Economics Dataset (2000–2025), analyzed in Python (JupyterLab, scikit-learn PCA implementation).
Interpretation
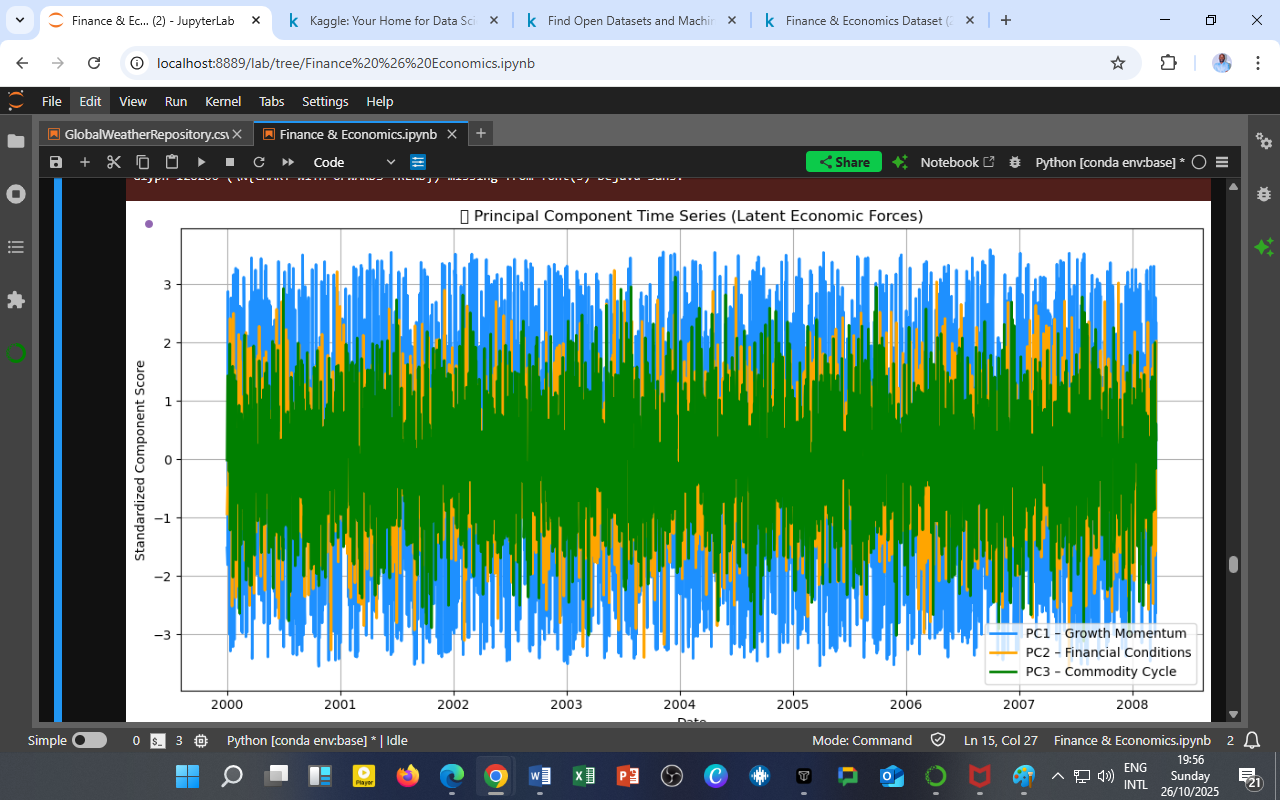
This time series visualization presents the temporal evolution of the three principal components — each representing a distinct latent economic driver extracted from correlated financial and macroeconomic variables.
| Component | Economic Interpretation | Description |
|---|---|---|
| PC1 – Growth Momentum (Blue) | Captures cyclical fluctuations in GDP, market prices, and corporate profitability. Represents short-run business cycle intensity and investor optimism. | |
| PC2 – Financial Conditions (Orange) | Driven by interest rates, debt levels, inflation, and monetary policy indicators. Reflects credit liquidity and financial stress. | |
| PC3 – Commodity Cycle (Green) | Influenced by exchange rates, gold prices, and trade-related metrics. Represents global demand–supply shifts and external shocks. |
Analytical Insight
-
PC1 (Growth Momentum) oscillates rapidly, signifying sensitivity to short-term financial sentiment and market volatility.
-
PC2 (Financial Conditions) shows medium-term persistence, consistent with monetary cycles or fiscal regime adjustments.
-
PC3 (Commodity Cycle) displays lower frequency movement, implying long-term external sector adjustments — e.g., energy or commodity shocks.
Observation:
Periods of synchronized positive scores across all PCs often coincide with economic expansions (e.g., early 2000s), whereas divergence (e.g., PC2 negative while PC1 positive) may reflect stagflation or policy misalignment.
Policy & Strategic Implications
-
Macro Policy Monitoring:
PCA time-series decomposition can help track underlying economic pressures before they manifest in standard metrics. -
Financial Stability Analysis:
Divergences between PC1 and PC2 provide early signals of financial overheating or monetary tightening impacts. -
Commodity Dependence Risks:
The PC3 cycle can guide trade policy and reserve management for commodity-sensitive economies. -
Education Application:
Within DatalytIQs Academy, this serves as an advanced demonstration of multivariate time-series dimension reduction, merging finance, economics, and data science.
Technical Summary
| Element | Specification |
|---|---|
| Method | Principal Component Analysis (scikit-learn) |
| Data Window | 2000–2025 (Daily observations) |
| Variables Included | Market indices, inflation, debt, rates, forex, trade, confidence |
| Standardization | Z-score normalization before PCA transformation |
| Output Metrics | Standardized component scores per time point |
Acknowledgment
Prepared by: Collins Odhiambo Owino
Institution: DatalytIQs Academy — Division of Data Science & Financial Analytics
Software: Python (pandas, scikit-learn, matplotlib)
Dataset: Finance & Economics Dataset (2000–2025)
License: Educational Research License — DatalytIQs Open Repository Initiative
Leave a Reply
You must be logged in to post a comment.