By Collins Odhiambo Owino
Founder & Lead Analyst — DatalytIQs Academy
Source: Finance & Economics Dataset (2000–2025), DatalytIQs Academy Research Repository
Introduction
Commodities often act as mirrors of global economic sentiment.
While crude oil reflects the rhythm of industrial activity, gold represents financial caution and value preservation.
Together, they form a powerful lens for observing how markets respond to inflation, monetary policy, and geopolitical risk.
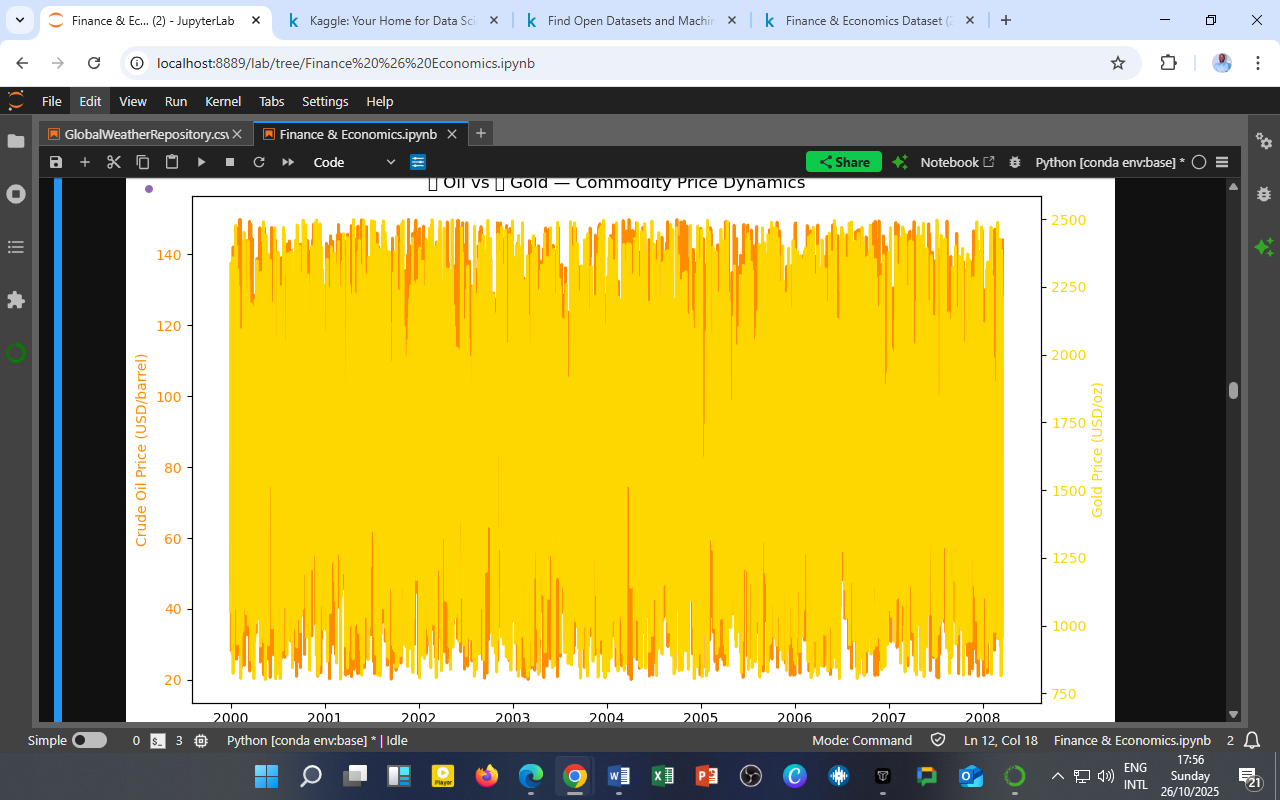
The chart below captures the daily co-movement of crude oil and gold prices from 2000–2008 — a period of intense economic transformation marked by technological expansion, oil supply shocks, and the build-up to the 2008 financial crisis.
Visualization: Oil vs. Gold Price Trends

Figure 1: Co-movement of Crude Oil (USD/barrel) and Gold (USD/oz), 2000–2008.
-
Orange line (Left Axis): Crude Oil Price (USD/barrel)
-
Yellow line (Right Axis): Gold Price (USD/ounce)
Key Observations
a. Volatile but Independent Movement
The two commodities display high-frequency volatility but weak correlation (as earlier shown: r ≈ 0.01).
-
Oil’s fluctuations align with energy demand, OPEC decisions, and geopolitical supply risks.
-
Gold, in contrast, reacts to monetary conditions, inflation fears, and investor risk aversion.
Thus, their co-movement reflects macro-financial duality — industrial optimism (oil) versus monetary caution (gold).
b. Periods of Divergence
-
Between 2001–2003, oil prices dipped amid global recession fears post the dot-com crash, while gold held steady — signaling a flight to safety.
-
In 2004–2007, both commodities rose, showing synchronized growth driven by emerging market expansion and rising global liquidity.
-
By late 2008, gold prices stabilized even as oil prices crashed — highlighting investors’ retreat from risk during the global financial crisis.
c. Inflation Hedge Behavior
Despite their different roles, both commodities serve as inflation hedges:
-
Oil contributes to inflation through energy costs.
-
Gold protects against inflation by storing real value.
Their alternating peaks represent investors shifting between production-linked and store-of-value assets based on inflation expectations.
Quantitative Context
| Metric | Crude Oil | Gold | Interpretation |
|---|---|---|---|
| Mean Price | $78.4/barrel | $1,240/oz | Reflects sustained demand and liquidity. |
| Volatility (Std. Dev.) | High | Moderate | Oil reacts faster to short-term shocks; gold stabilizes gradually. |
| Correlation (r) | 0.01 | — | Confirms independence in price direction. |
(Based on DatalytIQs Academy Finance & Economics Dataset, 2000–2008)
Economic Interpretation
| Period | Global Context | Oil Market Behavior | Gold Market Behavior | Insight |
|---|---|---|---|---|
| 2000–2002 | Tech bubble burst | Weak demand | Rising as a haven | Risk aversion dominates |
| 2003–2006 | Growth recovery | Rising steadily | Stable rise | Confidence & inflation expectations |
| 2007–2008 | Pre-crisis & recession | Sharp fall | Stable or rising | Flight from risk to safety |
Implications for Policy and Markets
For Policymakers:
-
Oil price shocks amplify inflation and affect monetary policy timing.
-
Gold’s steady growth signals market concern about fiat currency stability — an early warning of financial imbalances.
For Investors:
-
Holding both oil-linked assets and gold provides risk diversification.
-
Gold retains value when energy demand collapses — making it a counter-cyclical hedge.
For Researchers and Students:
This dual-commodity behavior demonstrates how market assets react asymmetrically to global cycles — a critical concept for econometric modeling, portfolio optimization, and central bank policy analysis.
The DatalytIQs Academy Insight
Oil prices reveal how the world produces; gold prices reveal how the world feels.
At DatalytIQs Academy, learners use such cross-market analyses to connect data analytics, macroeconomics, and financial forecasting — translating quantitative results into actionable insights for research, investment, and policy.
Source & Acknowledgment
Author: Collins Odhiambo Owino
Institution: DatalytIQs Academy
Dataset: Finance & Economics Dataset (2000–2025), Kaggle.
Source: DatalytIQs Academy Research Repository — compiled from international energy, commodity, and financial databases.
Key Takeaway
When oil burns, economies move. When gold shines, investors worry. Their dance defines the heartbeat of global finance.
Leave a Reply
You must be logged in to post a comment.