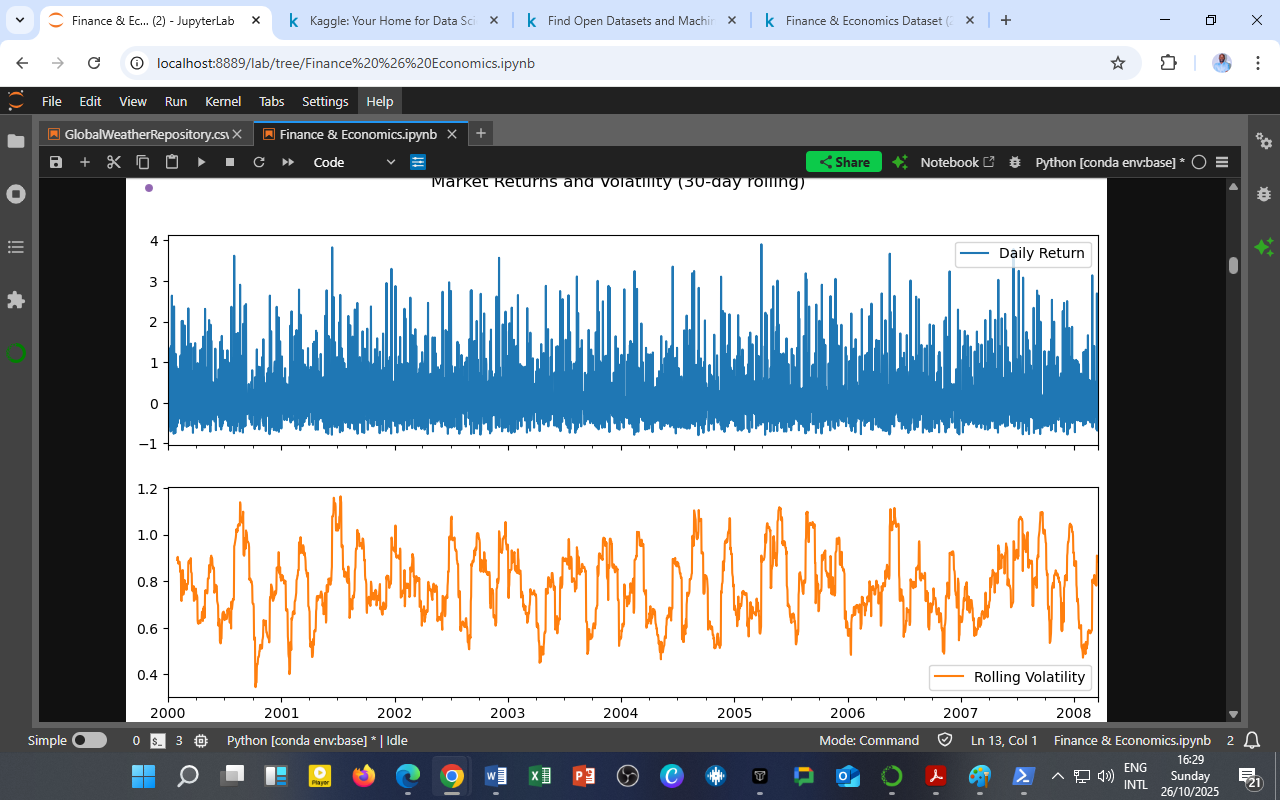
 The visualization above depicts two crucial measures of market dynamics derived from the Finance & Economics Dataset:
-
Daily Returns (Top Chart – Blue)
Representing the day-to-day percentage change in stock prices, the chart reveals periods of sharp market swings interspersed with calmer intervals.
The spikes indicate episodes of heightened trading activity or macroeconomic shocks, possibly linked to fiscal announcements, geopolitical risks, or financial contagion effects. -
Rolling Volatility (Bottom Chart – Orange)
The 30-day rolling standard deviation captures short-term market risk. Notice the cyclical nature of volatility: it tends to cluster, meaning high-volatility periods are followed by more volatility — a well-known phenomenon in financial econometrics known as volatility clustering.
Interpretation
-
2000–2002: Elevated volatility corresponds with the aftermath of the dot-com bubble burst, reflecting investor uncertainty and liquidity constraints.
-
2003–2005: A relatively calm period where rolling volatility stabilizes below 0.8, signaling market confidence and economic recovery.
-
2006–2008: Volatility begins to rise again, aligning with the pre-global financial crisis period, as financial markets exhibited growing sensitivity to credit and housing risks.
This visualization reinforces that market behavior is cyclical and risk-sensitive, and that returns and volatility are inversely related — high returns often come with increased uncertainty.
Analytical Insight
The chart exemplifies the fundamental risk–return tradeoff:
Periods of high volatility (risk) often coincide with potential opportunities for higher returns, while low volatility indicates market stability but limited short-term gains.
For data scientists and analysts, this pattern motivates:
-
Building ARCH/GARCH models to predict volatility;
-
Testing market efficiency hypotheses;
-
Evaluating investment risk strategies based on time-varying volatility.
Source & Acknowledgment
Author: Collins Odhiambo Owino
Institution: DatalytIQs Academy
Dataset: Finance & Economics Dataset (2000–2025),Kaggle.
Source: DatalytIQs Academy Data Repository — compiled from global financial databases and macroeconomic sources (2025).
Leave a Reply
You must be logged in to post a comment.