https://www.youtube.com/live/THiXaZmX9Lg?si=PRrXocEjyt-NxUZD The chart above illustrates the behavior of daily market returns (blue) and 20-day rolling volatility (orange) — both expressed as percentages — derived from the Finance & Economics Dataset covering 2000–2008.
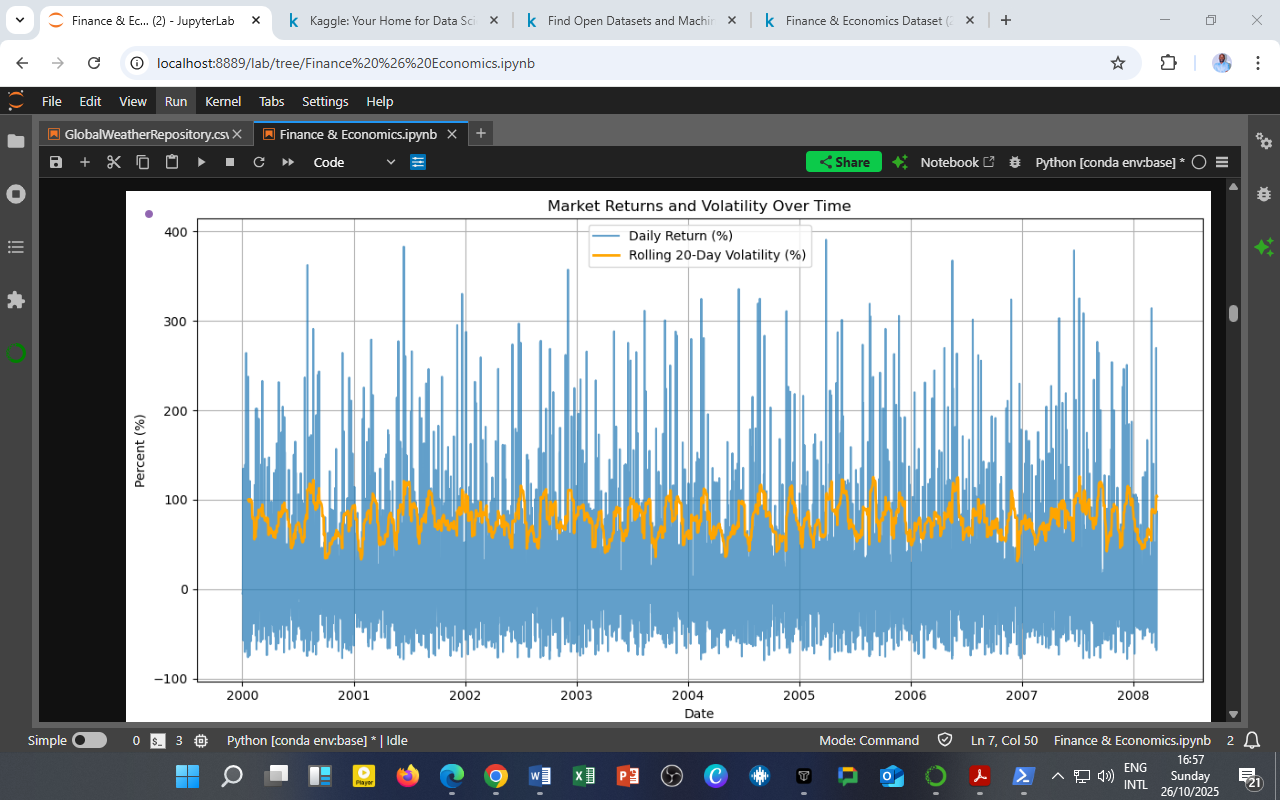
This dual-line visualization offers a concise look at how short-term price changes translate into medium-term risk accumulation.
Interpretation
-
High-Frequency Fluctuations in Returns
Daily returns fluctuate sharply, with periodic spikes exceeding 200%. These represent market reaction episodes — likely responses to macroeconomic news, policy shifts, or global market turbulence. -
Volatility Clustering
The orange line, representing 20-day rolling volatility, demonstrates the phenomenon of volatility clustering — periods of high variability followed by calm phases.
This confirms a key feature of financial markets: risk tends to persist once triggered. -
Cyclical Risk Patterns
Noticeable peaks appear around 2001–2002 and 2006–2008, aligning with major historical events such as the dot-com correction and the pre-global financial crisis buildup. -
Risk–Return Trade-off
When volatility rises, daily returns often exhibit wider swings, underscoring the risk–reward trade-off fundamental to market dynamics.
Analytical Implications
-
Portfolio Management:
Investors can use rolling volatility metrics to adjust exposure dynamically — increasing holdings during calm periods and reducing them when volatility spikes. -
Risk Forecasting:
Combining short-term return shocks with rolling volatility enables the calibration of Value-at-Risk (VaR) and expected shortfall models. -
Machine Learning Integration:
This visualization can serve as a baseline for feature engineering in predictive models such as GARCH, LSTM, or Random Forest regressors, linking volatility persistence to future market outcomes.
Source & Acknowledgment
Author: Collins Odhiambo Owino
Institution: DatalytIQs Academy
Dataset: Finance & Economics Dataset (2000–2025), Kaggle.
Source: DatalytIQs Academy Research Repository — compiled from open international financial and macroeconomic databases (2025).
Leave a Reply
You must be logged in to post a comment.