By Collins Odhiambo Owino
Author | DatalytIQs Academy
Data Source: Kenya National Bureau of Statistics (KNBS) – Kenya Data Portal
Introduction
Trade performance is a mirror of a nation’s economic health. In Kenya, imports and exports reveal how production, consumption, and external linkages interact with global markets. The latest data (December 2024 – September 2025) from the Kenya National Bureau of Statistics (KNBS) highlights evolving trends in both exports and imports, as shown below.
The figures, sourced from the Kenya Data Portal, capture Kenya’s total exports (including domestic and re-exports) and imports by category over ten months.
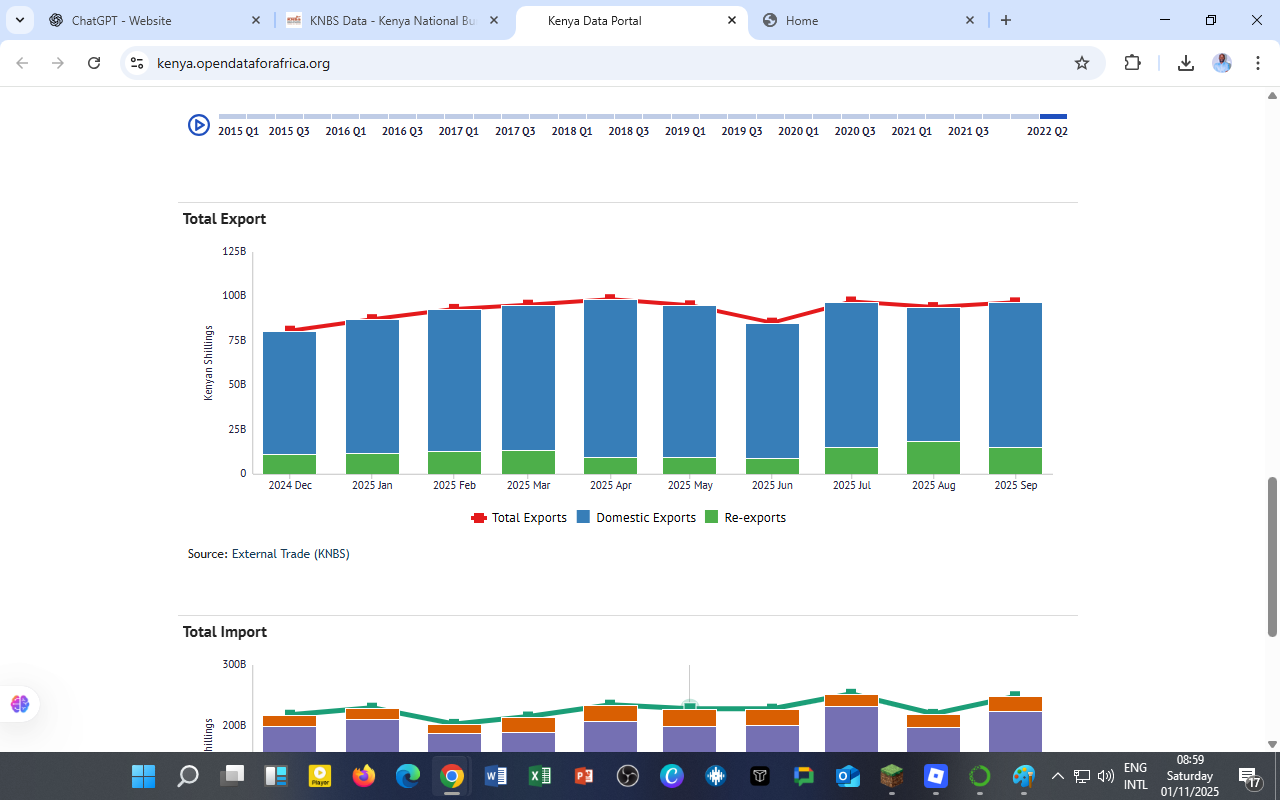
Export Trends (Dec 2024 – Sep 2025)

Kenya’s exports show a relatively stable performance, fluctuating between KSh 80 billion and KSh 110 billion per month.
Key observations:
-
Domestic Exports Dominate:
The blue bars indicate that most of Kenya’s exports come from domestic production, led by tea, horticulture, coffee, and manufactured goods. -
Re-exports Increasing Gradually:
The green segments reveal a slow but steady rise in re-exported goods, possibly reflecting Kenya’s growing role as a logistics hub within East Africa. -
Flattening Growth:
While total exports (red line) grew modestly until April 2025, they plateaued mid-year, signaling limited export diversification and external market challenges.
Import Trends (Dec 2024 – Sep 2025)

Kenya’s import bill remains high, averaging over KSh 220 billion monthly.
Category insights:
-
Industrial Supplies (Non-Food): Largest contributor to total imports, reflecting the country’s reliance on imported raw materials.
-
Fuel and Lubricants: A persistent cost driver linked to global oil prices and exchange rate depreciation.
-
Machinery and Transport Equipment: Continued infrastructure investment keeps these categories strong.
-
Food and Beverages: Vulnerable to agricultural shocks and dependent on imports for staple goods.
The Trade Deficit Challenge
Comparing the two charts reveals a structural imbalance:
-
Average Exports: ≈ KSh 100 billion/month
-
Average Imports: ≈ KSh 220 billion/month
→ Trade Deficit: Around KSh 120 billion per month
This persistent trade deficit reflects Kenya’s import-dependent economy, where local industries still rely on external inputs for production, and export diversification remains limited.
Economic and Policy Insights
-
Encourage Local Manufacturing:
Investment in domestic industries that can replace imported goods (e.g., fertilizer, steel, textiles) is critical. -
Value Addition for Exports:
Moving beyond raw agricultural exports to processed goods would raise export value and reduce vulnerability to price shocks. -
Regional Trade Opportunities:
Leveraging AfCFTA and EAC markets can strengthen Kenya’s export base and stimulate intra-African trade. -
Energy Transition:
Reducing reliance on imported fuel through renewable energy projects will stabilize the balance of payments.
For Learners and Analysts
For data enthusiasts at DatalytIQs Academy, this dataset provides opportunities to:
-
Practice time-series and trade balance analysis using Pandas or Excel.
-
Compute import-to-export ratios and visualize trends with Matplotlib or Plotly.
-
Build predictive models (e.g., ARIMA or exponential smoothing) for trade forecasting.
Summary Table (Approximate Monthly Averages, Jan–Sep 2025)
| Indicator | Average (KSh Billion) | Trend |
|---|---|---|
| Total Exports | 100 | ↗ Slight Increase (Q1–Q2) |
| Total Imports | 220 | ↘ Mild Dip in May–June |
| Trade Deficit | 120 | ↔ Persistent |
| Main Export | Tea, Horticulture | — |
| Main Import | Fuel, Machinery | — |
Data Source and Acknowledgment
Dataset: External Trade Statistics, 2024–2025
Source: Kenya Data Portal – KNBS External Trade
Acknowledgment: Kenya National Bureau of Statistics (KNBS) and the African Development Bank for supporting open-access data initiatives in Africa.
Author: Collins Odhiambo Owino, DatalytIQs Academy.
Leave a Reply
You must be logged in to post a comment.