Seismic Features, Temporal Trends, and Global Distribution Analysis (2001–2022)
Overview
The Global Earthquake–Tsunami Risk Assessment Dataset is a comprehensive, machine learning–ready dataset that records 782 significant earthquakes worldwide from 2001 to 2022.
Each record includes detailed seismic parameters such as magnitude, depth, intensity, and tsunami potential, making it a valuable resource for tsunami prediction, hazard assessment, and AI-driven geophysical modeling.
Developed under the DatalytIQs Academy Research Initiative, this analysis blends earth science, statistics, and data visualization to promote a data-driven understanding of natural disasters.
Dataset Highlights
| Attribute | Details |
|---|---|
| Period Covered | 2001 – 2022 |
| Total Records | 782 earthquakes |
| Coverage | Global (Latitude −61.85° to 71.63°, Longitude −179.97° to 179.66°) |
| Completeness | 100% (no missing values) |
| Target Variable | Tsunami indicator (0 = No, 1 = Yes) |
| File Format | CSV (~41KB) |
Tsunami Event Classification:
-
Non-Tsunami Events: 478 (61.1%)
-
Tsunami-Potential Events: 304 (38.9%)
-
Balanced Dataset: Ideal for binary classification and deep learning models.
1. Descriptive Statistics
| Feature | Mean | Std | Min | Max | Description |
|---|---|---|---|---|---|
| Magnitude | 6.94 | 0.45 | 6.5 | 9.1 | Earthquake strength (Richter) |
| Depth (km) | 75.88 | 137.28 | 2.7 | 670.8 | Focal depth |
| Significance (sig) | 870.1 | 322.5 | 650 | 2910 | Event hazard score |
| Latitude | 3.54 | 27.30 | −61.85 | 71.63 | Geographic range |
| Longitude | 52.61 | 117.90 | −179.97 | 179.66 | Epicentral coverage |
| CDI (Community Intensity) | 4.33 | 3.17 | 0 | 9 | Perceived shaking |
| MMI (Mercalli Intensity) | 5.96 | 1.46 | 1 | 9 | Structural impact |
| NST (Stations) | 230.25 | 250.18 | 0 | 934 | Seismic monitoring coverage |
| Year | 2012.28 | 6.10 | 2001 | 2022 | Temporal span |
| Tsunami (binary) | 0.39 | 0.49 | 0 | 1 | Target variable |
Summary
The dataset shows an average magnitude near 7.0, capturing globally significant quakes.
A wide depth range (3–670 km) ensures both shallow and deep events are represented.
The balanced tsunami variable (39% positive) enhances its value for AI model training.
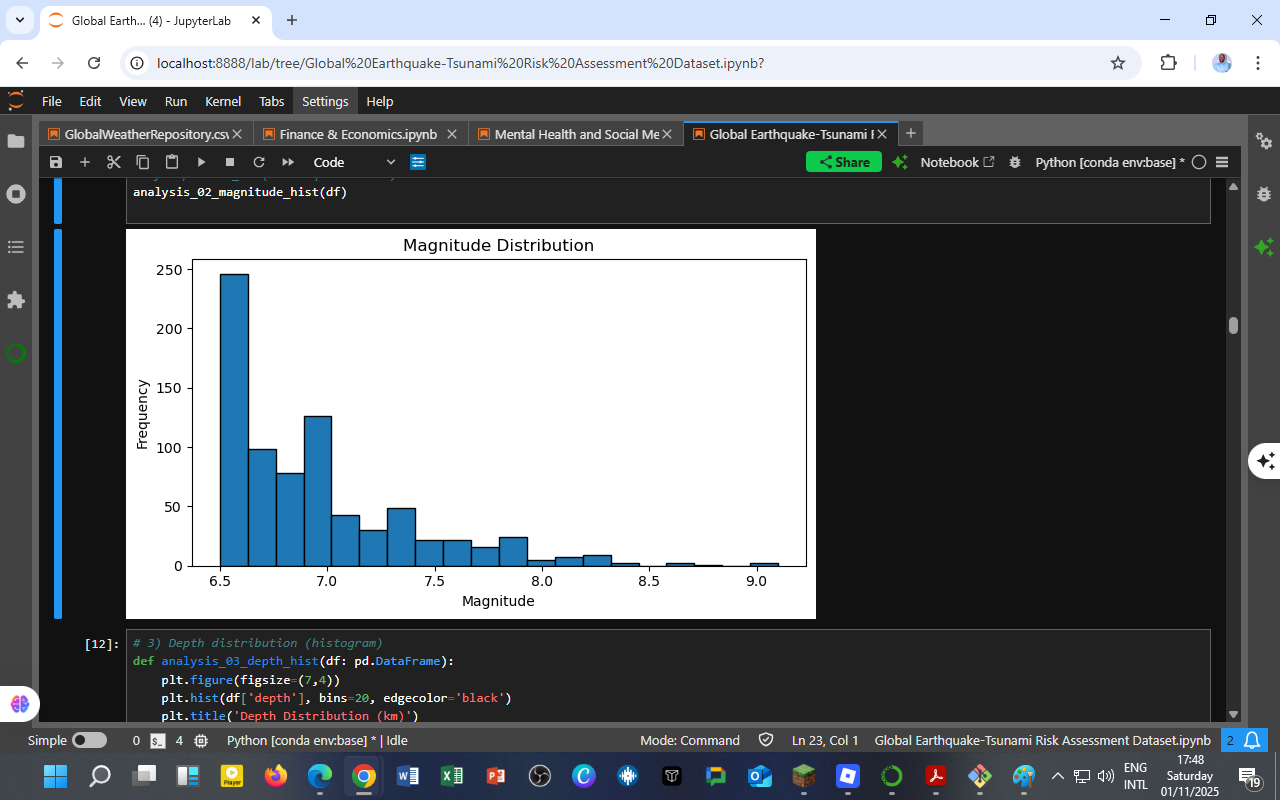
2. Magnitude Distribution

Interpretation
-
The histogram reveals a left-skewed distribution, showing that most global quakes fall between 6.5 and 7.2 magnitude.
-
Fewer events exceed magnitude 8.0, representing the rare mega-earthquakes (e.g., Sumatra 2004, Japan 2011).
-
The steep decline after magnitude 7.5 demonstrates the logarithmic nature of seismic energy release: every 1-point increase equals roughly 32× more energy.
This reinforces that while smaller quakes are frequent, large ones dominate damage and tsunami generation.
3. Magnitude vs Depth of Earthquakes

Insights
-
Shallow earthquakes (<100 km) dominate high magnitudes and are more destructive.
-
Deep events (>500 km) tend to have moderate magnitudes, indicating less surface impact.
-
The clustering confirms subduction zones as the main regions of high seismic energy release.
4. Earthquake Frequency Over Time

Observations
-
Annual events fluctuate between 25–55, with spikes in 2010–2015, aligning with several mega-quakes.
-
2011 and 2013 recorded the highest global activity.
-
No linear trend is evident, emphasizing irregular tectonic release rather than time-based cycles.
Implication
Predictive earthquake modeling must therefore rely on real-time geophysical indicators (e.g., plate stress, GPS deformation) instead of purely temporal data.
5. Global Distribution of Earthquakes

Geographic Patterns
-
Most events cluster along major tectonic boundaries:
-
Pacific Ring of Fire — Japan, Indonesia, Chile, Alaska.
-
Himalayan–Eurasian Belt — India, Nepal, Tibet.
-
Mid-Atlantic Ridge — Oceanic spreading zones.
-
-
The color scale shows magnitude intensity — brighter points indicate stronger events.
This distribution visually confirms that tectonic boundaries are the Earth’s most active seismic regions.
6. Machine Learning and Policy Applications
-
Tsunami Classification Models: Predict tsunami potential using seismic features.
-
Hazard Mapping: Visualize global high-risk zones.
-
Predictive Analytics: Use AI to assess future seismic hazards.
-
Infrastructure Planning: Guide resilient construction policies in coastal nations.
-
Real-Time Alerts: Feed trained models into IoT sensor systems for early warning.
7. Data Quality & Scientific Value
-
Zero missing values across all 13 columns
-
Global spatial coverage (−180° to 180°)
-
Balanced tsunami cases (39%)
-
28 major earthquakes (≥8.0 magnitude)
-
Suitable for ML, visualization, and disaster risk analytics
Acknowledgment
This analysis was conducted by DatalytIQs Academy, a multidisciplinary education platform specializing in Mathematics, Economics, and Geoscience Analytics.
Data Source: Kaggle — Global Earthquake–Tsunami Risk Assessment Dataset (2001–2022)
Tools Used: Python, Pandas, Matplotlib, Seaborn, and JupyterLab
“At DatalytIQs Academy, we transform seismic data into global foresight — empowering resilience through analytics.”
— Collins Odhiambo Owino, Founder
Leave a Reply
You must be logged in to post a comment.