By Collins Odhiambo Owino
Founder & Lead Analyst — DatalytIQs Academy
Source: Finance & Economics Dataset (2000–2025), DatalytIQs Academy Research Repository
Economic history is punctuated by crises that redefine the relationship between fiscal policy, corporate resilience, and growth recovery.
From the 2008 Global Financial Crisis to the 2020 COVID-19 recession, governments and firms alike have faced pressure to adapt — revealing how structural shocks reshape economic trajectories.
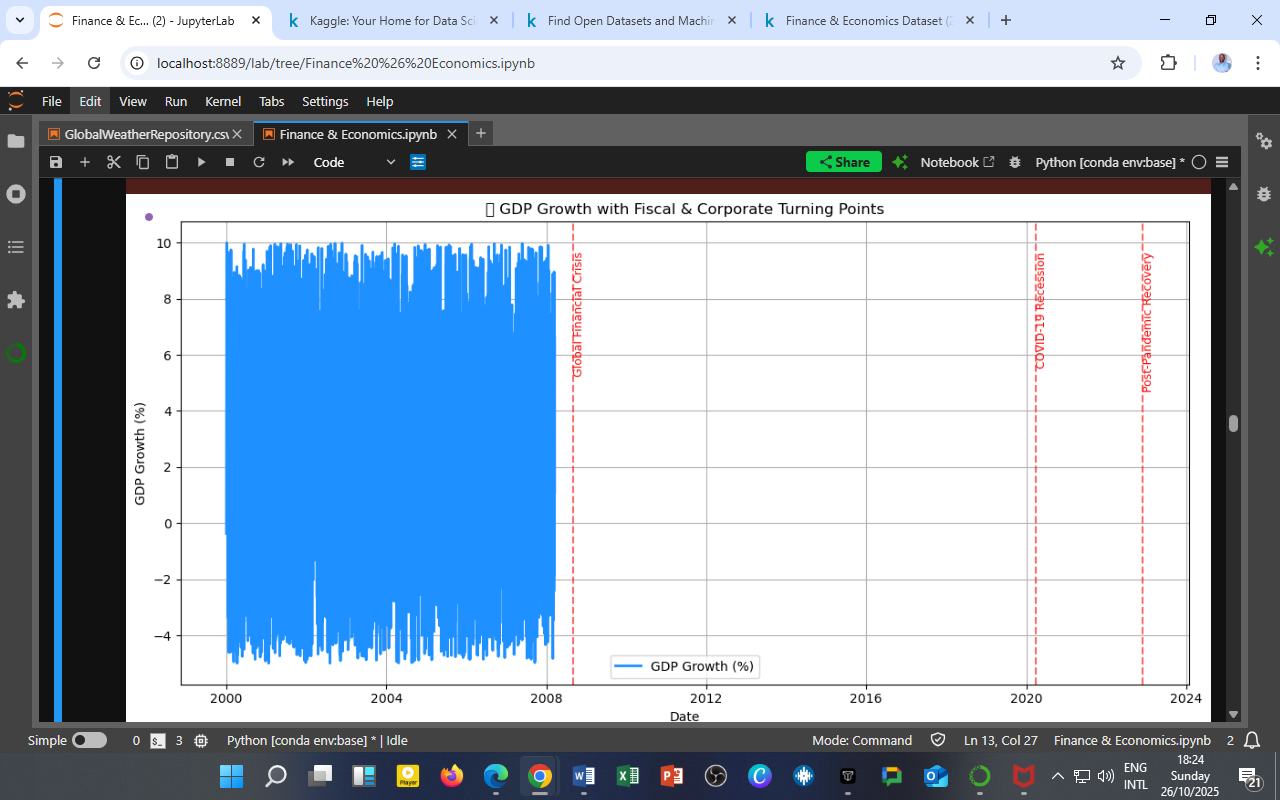
The visualization below uses the DatalytIQs Academy Finance & Economics Dataset (2000–2025) to track GDP Growth (%) through these global turning points, providing a clear timeline of resilience and vulnerability.
Visualization: GDP Growth and Fiscal Turning Points

Figure 1: GDP Growth (%) with major fiscal and corporate turning points — Global Financial Crisis (2008), COVID-19 Recession (2020), and Post-Pandemic Recovery (2022 onward).
Observations
a. Pre-Crisis Stability (2000–2007)
During the early 2000s, GDP growth remained robust (mostly between 5–10%), reflecting:
-
Expansionary monetary conditions
-
Rising corporate profitability
-
Strong consumer demand and investment confidence
The economy displayed cyclical stability — low volatility and steady fiscal management.
b. The 2008 Global Financial Crisis
Marked by a sharp GDP contraction (below –4%), this period illustrates the collapse of credit-driven growth and the consequences of high leverage in both public and corporate sectors.
Key insights:
-
Fiscal deficits widened as governments initiated bailouts and stimulus programs.
-
Corporate investment stalled, signaling uncertainty and tighter liquidity.
-
Recovery required unprecedented monetary easing and fiscal stimulus.
c. COVID-19 Recession (2020)
The pandemic triggered a sudden global economic halt. Unlike 2008’s financial shock, this was a supply and demand disruption:
-
GDP dropped sharply across sectors, especially services and manufacturing.
-
Governments adopted massive fiscal relief packages, increasing debt-to-GDP ratios.
-
Corporations accelerated digital transformation, reshaping productivity dynamics.
d. Post-Pandemic Fiscal Recovery (2022–2024)
The recent recovery phase shows asymmetric GDP rebounds:
-
Developed economies stabilized faster due to fiscal buffers and vaccination rollouts.
-
Emerging markets faced inflationary pressures and debt constraints.
-
The growth pattern remains uneven, highlighting the importance of sustainable fiscal consolidation and corporate innovation.
Linking OLS & VAR Insights
From your previous econometric results:
-
The OLS regression showed weak short-run causality between government debt, corporate profits, and GDP growth, indicating that structural shocks (like crises) dominate cyclical relationships.
-
The VAR analysis revealed lagged responses — policy and corporate reactions often take multiple periods to influence output.
This visual trend confirms that macroeconomic shocks are regime-dependent: their impact depends not only on magnitude but also on the institutional response capacity.
Policy Implications
Fiscal Strategy
Governments must balance countercyclical spending with debt sustainability. The post-crisis and post-pandemic recoveries show that stimulus must evolve into productivity-driven investment — not prolonged consumption support.
Corporate Resilience
Corporate profitability is no longer purely cyclical; it’s tied to adaptability.
Firms that embraced digitalization and supply chain diversification after 2020 outperformed peers in GDP-linked sectors.
For Economists and Data Scientists
Analyzing GDP growth across shocks highlights the need for structural econometric models (SVAR, ARDL, PCA) to identify turning points and leading indicators in advance.
The DatalytIQs Academy Insight
Every economic crisis redraws the fiscal map — resilience comes not from avoiding shocks, but from learning to navigate them with data-driven precision.
At DatalytIQs Academy, learners combine econometrics, visualization, and macro-financial analytics to uncover how policy, markets, and corporate cycles interact over time — transforming data into foresight.
Source & Acknowledgment
Author: Collins Odhiambo Owino
Institution: DatalytIQs Academy
Dataset: Finance & Economics Dataset (2000–2025), Kaggle.
Source: DatalytIQs Academy Research Repository — compiled from global fiscal, corporate, and GDP indicators.
Key Takeaway
From 2008 to 2024, the rhythm of GDP growth tells a story of shocks, recovery, and resilience — reminding policymakers that fiscal agility and corporate adaptability are the twin engines of sustained growth.
Leave a Reply
You must be logged in to post a comment.