By Collins Odhiambo Owino — DatalytIQs Academy
Data Source: Kaggle (Digital Wellbeing Dataset, 2025)
Introduction
In a data-driven world, age shapes how we connect, learn, and thrive online. At DatalytIQs Academy, we explore not just numbers — but the human stories hidden behind them.
Using a Kaggle-sourced Digital Wellbeing dataset, we examined how age influences digital engagement across a sample of 500 respondents worldwide.
Our goal? To understand the digital age spectrum — from Gen Z’s hyper-connected lifestyles to the balanced digital routines of older adults.
The Age Landscape
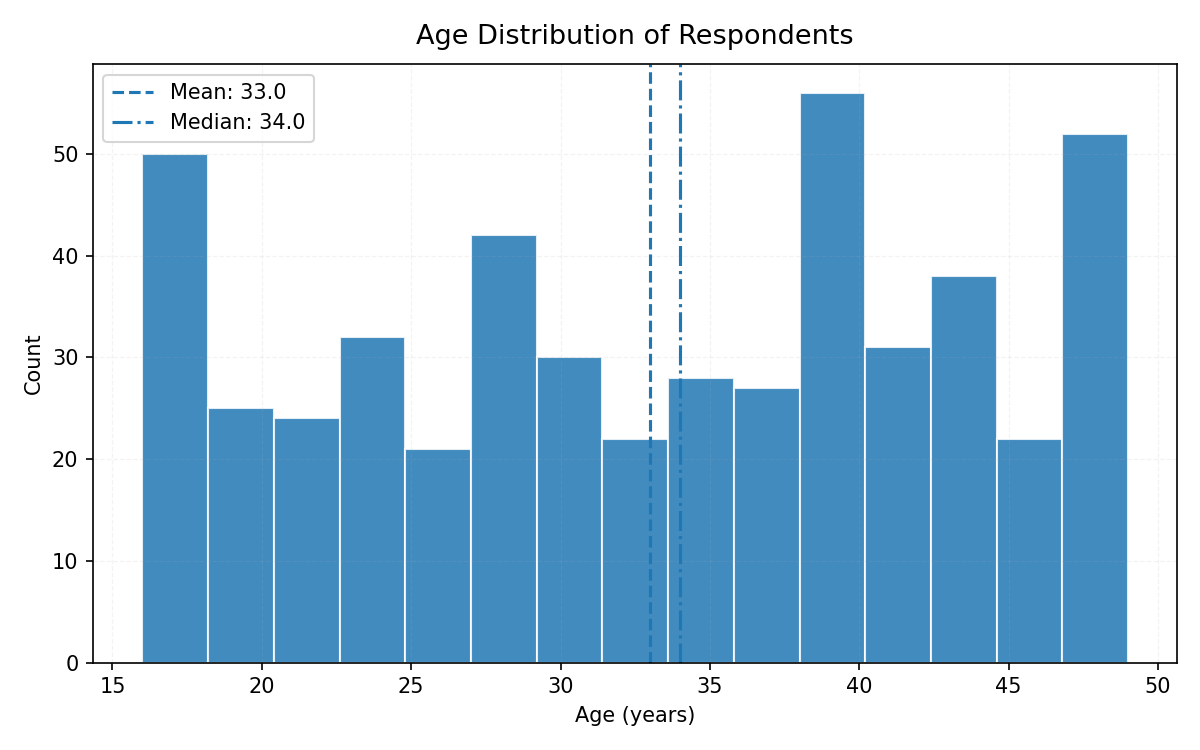
The figure below shows the Age Distribution of Respondents, captured from our analysis using Python and Matplotlib.
Figure 1: Age Distribution of Respondents
(Image Source: 1_age_distribution.png)

This histogram reveals:
-
The average (mean) age of respondents is approximately 33 years,
-
The median age — where half are younger and half are older — is 34 years,
-
Most participants fall between 25 and 40 years, representing a tech-savvy, digitally mature population.
Interpreting the Trends
Younger respondents (ages 18–25) display a more dispersed pattern, reflecting diverse digital lifestyles — from creators and gamers to influencers.
Meanwhile, participants in their 30s and 40s tend to show stabilized digital engagement, likely balancing professional, personal, and online social spheres.
This mirrors global trends reported by Pew Research (2023) and Statista (2024), where screen-time intensity declines slightly with age, but online dependency remains strong across all groups.
Why It Matters
Understanding age distribution helps data scientists and policymakers alike:
-
Design better digital education programs by tailoring approaches to generational habits.
-
Promote digital well-being by addressing screen-time fatigue among younger users.
-
Inform businesses and app developers about audience segmentation for targeted engagement.
At DatalytIQs Academy, we emphasize how data visualization bridges analytics and empathy — turning raw numbers into actionable insight.
Behind the Analysis
-
Dataset: Digital Wellbeing & Social Media Usage Dataset — Kaggle (2025)
-
Tools Used: Python, pandas, Matplotlib
-
Figure Saved From: JupyterLab Environment
-
Author: Collins Odhiambo Owino, Educator & Data Analyst
-
Institution: DatalytIQs Academy — Mathematics, Economics & Finance Online School
About DatalytIQs Academy
DatalytIQs Academy is a global online platform empowering learners to master Mathematics, Economics, and Data Science through real-world projects, analytics-driven education, and hands-on skill building.
From foundational statistics to advanced predictive modeling, our mission is to help you turn data into discovery.
Visit: www.datalytiqs.academy
Email: info@datalytiqs.academy
Acknowledgement
We acknowledge:
-
Kaggle for providing open-source datasets that power this analysis.
-
DatalytIQs Academy for facilitating research and visualization tools.
-
Collins Odhiambo Owino, the lead author and educator who prepared this study and visualization.
Conclusion
This analysis is more than a histogram — it’s a glimpse into the digital pulse of today’s society.
As we expand this project, future blogs will explore correlations between age, screen time, sleep quality, and happiness, deepening our understanding of digital wellbeing in a connected world.
Leave a Reply
You must be logged in to post a comment.