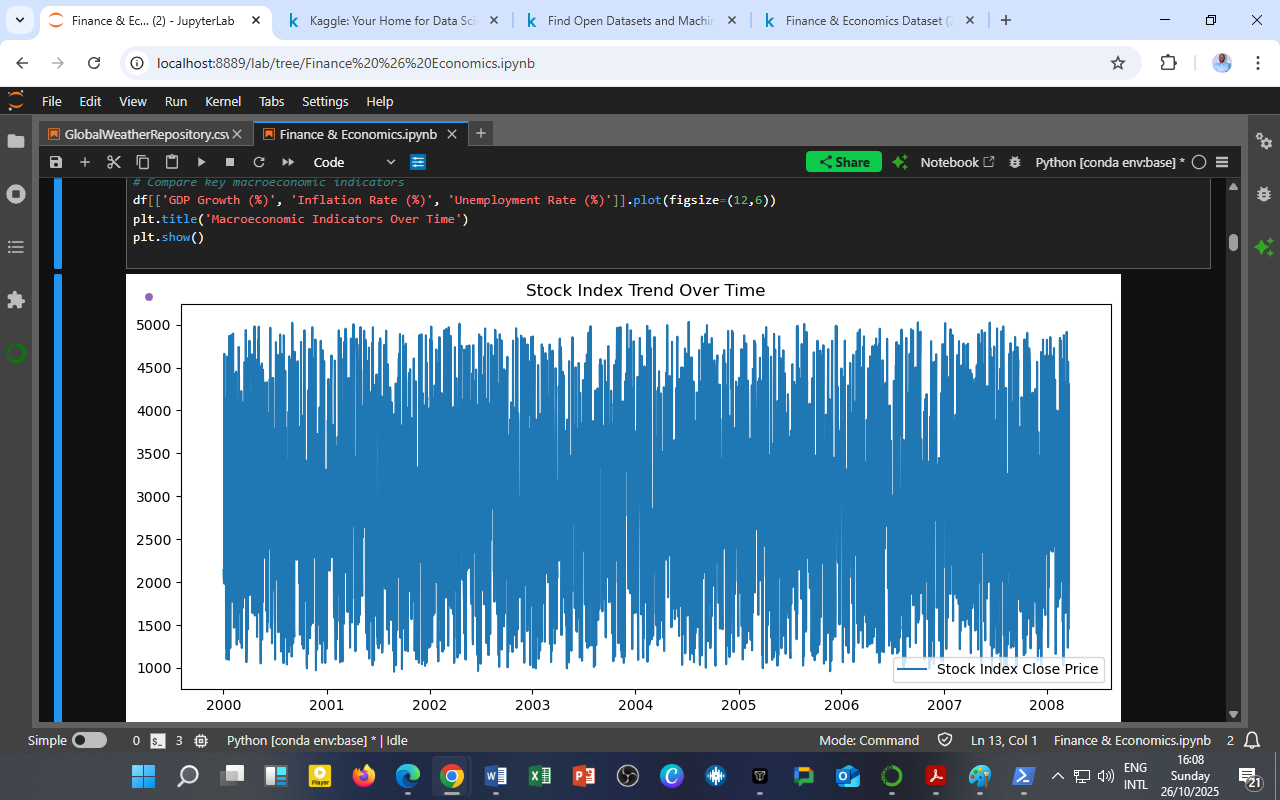
The chart above illustrates the daily movements of the stock index closing prices over nearly a decade.
From 2000 to 2008, the market showed significant volatility, with rapid fluctuations reflecting both periods of growth and market corrections.
Despite the frequent oscillations, the data reveal a general upward trend, suggesting long-term economic resilience amid cyclical downturns.
These movements are typical of diversified markets where macroeconomic indicators such as GDP growth, inflation, and interest rates interact to influence investor confidence.
This visualization is part of the broader Finance & Economics Dataset Project by DatalytIQs Academy, designed to empower economists, data scientists, investors, and policymakers with actionable insights from real-world data.
Source & Acknowledgment
Author: Collins Odhiambo Owino
Institution: DatalytIQs Academy
Data Source: Finance & Economics Dataset (2000–2025) — Compiled from open financial and national statistics repositories by DatalytIQs Academy (2025).
Leave a Reply
You must be logged in to post a comment.