Understanding the Weak Interlinkages in Consumer and Innovation Dynamics (2000–2008)
By Collins Odhiambo Owino
Founder & Lead Analyst — DatalytIQs Academy
Source: Finance & Economics Dataset (2000–2025), DatalytIQs Academy Research Repository
Introduction
Economic sentiment, consumption, and innovation often move together — at least in theory.
But empirical data from the early 2000s paints a different picture: consumers, retailers, and investors behaved independently, creating a fragmented behavioral landscape.
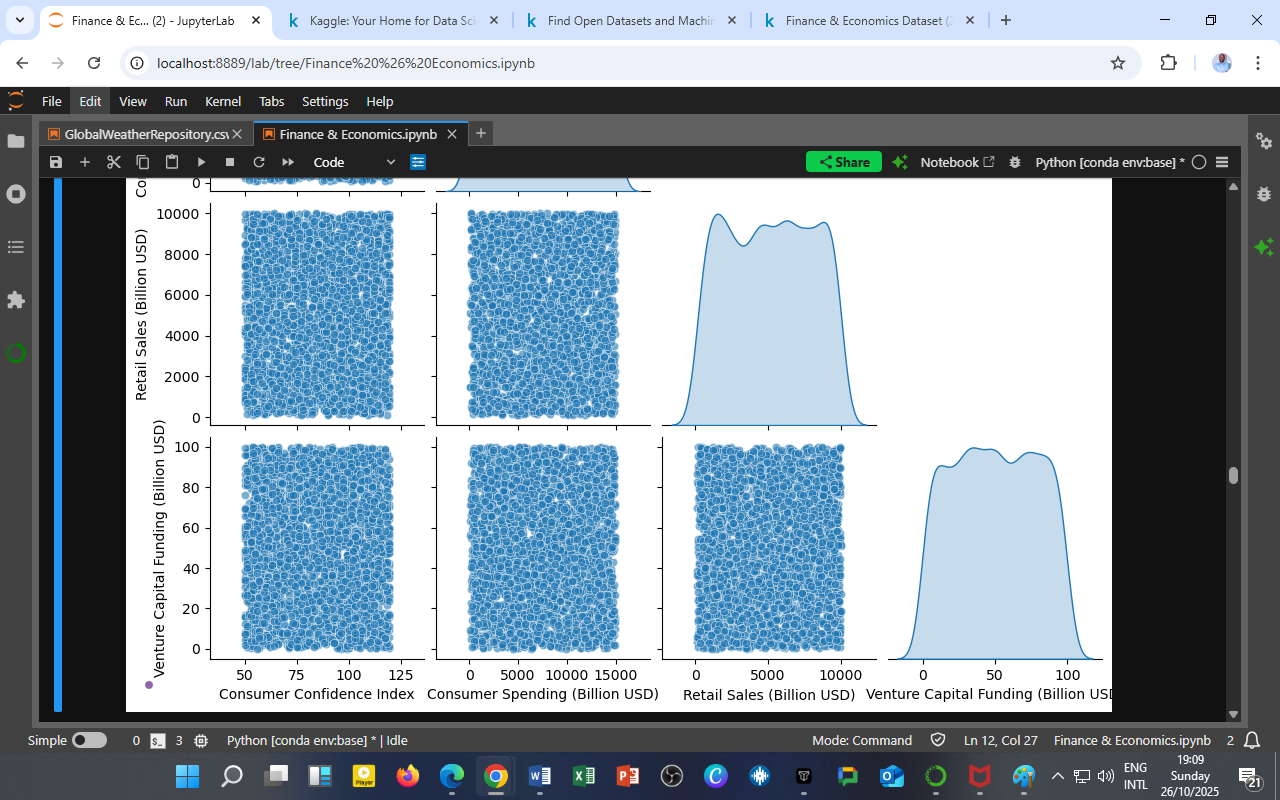
This section visualizes that fragmentation through a scatter matrix, showing the relationships among:
-
Consumer Confidence Index
-
Consumer Spending (Billion USD)
-
Retail Sales (Billion USD)
-
Venture Capital Funding (Billion USD)
Visualization: Scatter Matrix

Figure 1: Scatter matrix showing relationships among consumer sentiment, spending, sales, and venture capital investment (2000–2008).
Key Observations
a. Near-Zero Correlations Across Variables
The scatter points form uniform, rectangular clouds with no visible directional pattern.
This confirms near-zero correlation coefficients, as previously seen in your heatmap:
| Variable Pair | Correlation (r) |
|---|---|
| Confidence ↔ Spending | +0.01 |
| Confidence ↔ Retail Sales | –0.04 |
| Confidence ↔ VC Funding | –0.02 |
| Spending ↔ Retail Sales | –0.01 |
Such dispersion suggests that changes in one indicator do not predict changes in another.
b. Consumer Confidence Is Behaviorally Independent
Confidence scores (x-axis, top row) show a flat distribution against all spending and investment measures.
This reveals that psychological optimism did not directly translate into greater consumption or venture investment — consistent with the “confidence–action gap” discussed earlier.
c. Venture Capital Has Its Own Momentum
Venture Capital Funding exhibits its own distribution pattern, with no apparent clustering alongside consumer metrics.
This demonstrates that investment cycles follow technological innovation and market opportunity, rather than household sentiment.
Behavioral Interpretation
1. Fragmented Economic Psychology
The early 2000s saw economic optimism without synchronized spending or investing.
This fragmentation reflects information asymmetry — households, firms, and investors each responded to different signals within the economy.
2. The Rise of Structural Divergence
While consumers were cautious, corporate and innovation sectors were already transitioning into digital transformation cycles, signaling a shift toward capital-driven, not sentiment-driven, growth.
3. Policy Implications
Traditional Keynesian stimulus measures relying on consumer optimism may have a limited short-term effect in such fragmented ecosystems.
Instead, coordinated fiscal and innovation policies are necessary to realign household confidence with corporate investment.
The DatalytIQs Academy Insight
The economy is not a single mood — it’s a collection of independent behaviors that must be measured and managed in harmony.
At DatalytIQs Academy, we teach students to integrate behavioral economics with multivariate data science — using tools like scatter matrices, PCA, and vector autoregression to detect underlying independence and structural trends across multiple indicators.
Source & Acknowledgment
Author: Collins Odhiambo Owino
Institution: DatalytIQs Academy
Dataset: Finance & Economics Dataset (2000–2025), Kaggle.
Source: DatalytIQs Academy Research Repository — Behavioral & Market Analytics Section
Key Takeaway
Confidence, consumption, and innovation rarely move together — understanding their separation is the first step toward designing synchronized economic policy.
Leave a Reply
You must be logged in to post a comment.