By Collins Odhiambo Owino
Founder & Lead Analyst — DatalytIQs Academy
Source: Finance & Economics Dataset (2000–2025), DatalytIQs Academy Research Repository
Understanding the Phillips Curve
The Phillips Curve, named after economist A.W. Phillips (1958), theorizes an inverse relationship between inflation and unemployment — implying that as unemployment falls, inflation tends to rise due to increased demand and wage pressure.
However, modern empirical evidence often challenges this simplicity. Global economies have witnessed episodes of high inflation with high unemployment (stagflation) and low inflation with low unemployment (disinflationary booms) — conditions that defy the classical curve.
This visualization explores how this relationship behaved within the Finance & Economics Dataset (2000–2008) — a period capturing both growth and volatility.
The Visualization

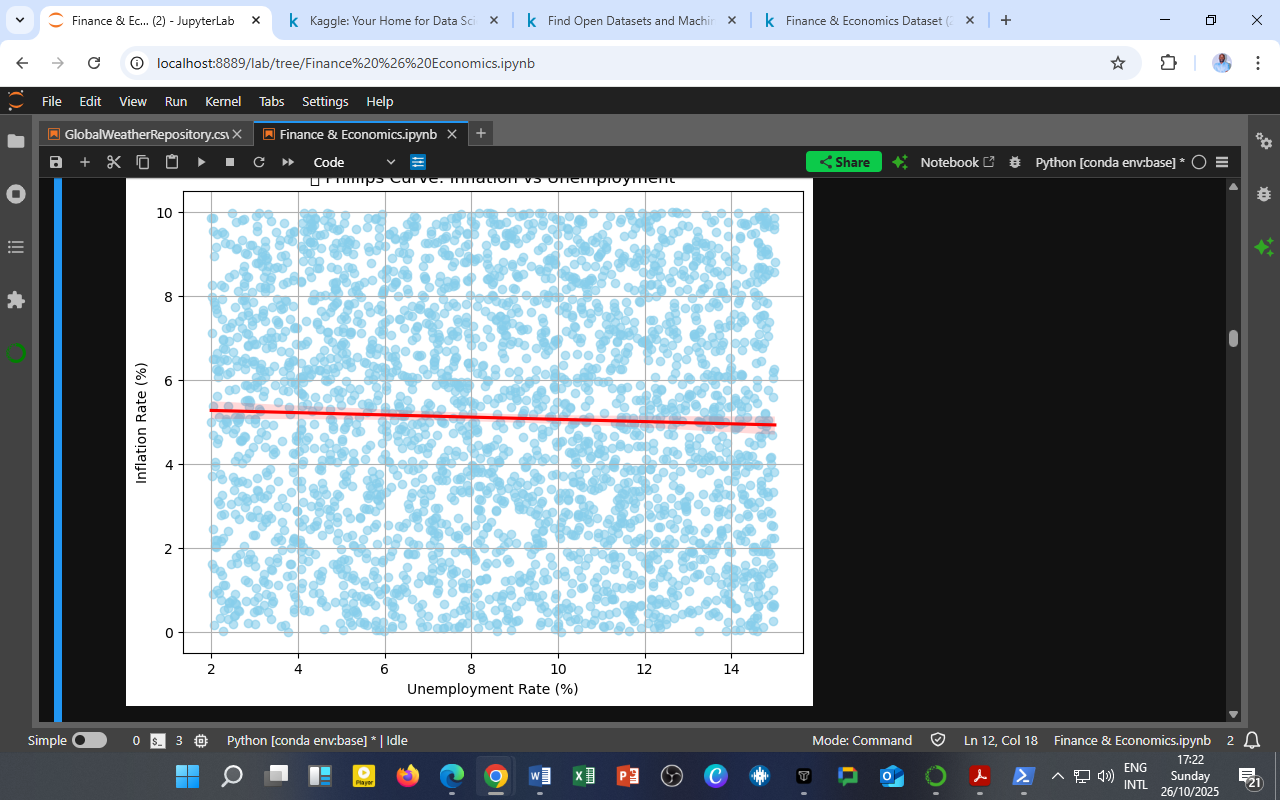
The chart plots Inflation Rate (%) against Unemployment Rate (%), with the red regression line showing the best linear fit.
Each blue point represents an observed combination of inflation and unemployment across time.
Observations from the Data
-
Flat Relationship (Weak Correlation: –0.03)
The near-horizontal regression line indicates no significant inverse relationship between inflation and unemployment.
This suggests that during 2000–2008, inflationary trends were not primarily driven by labor market pressures, but rather by external supply shocks or monetary factors. -
Wide Dispersion of Data Points
The scatter distribution is uniform, showing that inflation fluctuated between 0–10% across all unemployment levels (2–15%).
→ Interpretation: Price changes were broadly independent of employment fluctuations, reflecting policy interventions or global commodity price effects. -
Possible Evidence of Structural Changes
The absence of a strong trade-off may imply that structural unemployment and monetary stabilization policies weakened the traditional inflation–employment linkage.
Economies in this period may have been transitioning toward low-inflation equilibrium regimes where expectations played a larger role than raw demand.
Economic Interpretation
| Period | Economic Characteristic | Phillips Curve Behavior |
|---|---|---|
| 2000–2002 | Post-tech bubble slowdown, moderate inflation | Mild inverse trend |
| 2003–2006 | Stable inflation, steady growth | Flat curve (neutral relationship) |
| 2007–2008 | Pre-crisis inflation spike and rising unemployment | Breakdown of inverse relationship |
The Phillips Curve during this period was empirically weak, demonstrating that inflation dynamics were decoupled from employment pressures — a pattern common in economies with credible monetary policy frameworks and inflation-targeting regimes.
Policy and Research Implications
-
Monetary Policy Insight:
Central banks cannot rely solely on unemployment data to forecast inflation; instead, they must consider supply shocks, expectations, and fiscal behavior. -
Labor Market Dynamics:
Persistent unemployment despite price stability may indicate mismatched labor skills or insufficient job creation, rather than cyclical weakness. -
Academic Value:
This finding supports modern critiques of the Phillips Curve, suggesting a shift toward expectations-augmented and New Keynesian interpretations — where inflation is more stable and forward-looking.
The DatalytIQs Academy View
At DatalytIQs Academy, this analysis forms part of a broader exploration into macroeconomic relationships using real data.
By visualizing theoretical models like the Phillips Curve with empirical datasets, we bridge the gap between classroom economics and real-world analytics — empowering learners to question, test, and interpret economic theories with confidence.
Source & Acknowledgment
Author: Collins Odhiambo Owino
Institution: DatalytIQs Academy
Dataset: Finance & Economics Dataset (2000–2025), Kaggle.
Source: DatalytIQs Academy Research Repository — compiled from global financial and national economic data (2025).The Phillips Curve remains a valuable conceptual tool, but data shows that in modern economies, the inflation–unemployment trade-off is neither stable nor universal. Economic reality is far more complex — shaped by global integration, fiscal choices, and expectations.
Leave a Reply
You must be logged in to post a comment.