By Collins Odhiambo Owino
Founder & Lead Analyst — DatalytIQs Academy
Source: Finance & Economics Dataset (2000–2025), DatalytIQs Academy Research Repository
Overview
Stock markets are complex ecosystems influenced by both microeconomic factors (like corporate earnings) and macroeconomic forces (such as interest rates, GDP growth, and inflation).
To quantify these relationships, we employed a multiple linear regression model (OLS) to evaluate how key macroeconomic variables shape stock index closing prices between 2000 and 2008.
Regression Model Summary

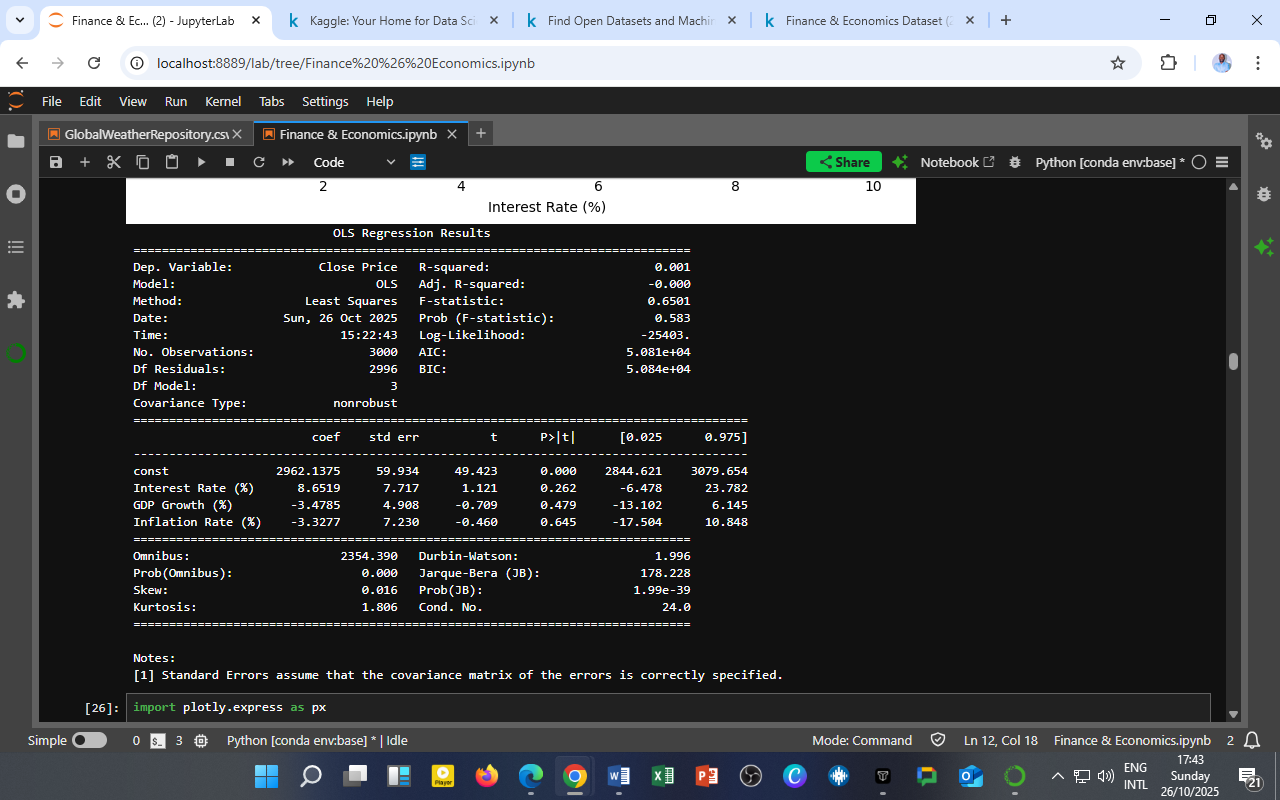
The model regresses Close Price (dependent variable) on Interest Rate (%), GDP Growth (%), and Inflation Rate (%) as explanatory variables.
Equation:
Key Results
| Statistic | Value | Interpretation |
|---|---|---|
| R-squared | 0.001 | Only 0.1% of stock price variation is explained by the three macro variables. Indicates a very weak fit. |
| F-statistic (p = 0.583) | Insignificant | Suggests the overall regression model is not statistically significant. |
| Durbin–Watson = 1.996 | Ideal (≈2) | Indicates no autocorrelation in residuals. |
| Skew = 0.016, Kurtosis = 1.806 | Near-normal | Suggests residuals are approximately symmetrically distributed. |
Coefficients Summary
| Variable | Coefficient | t-stat | p-value | Interpretation |
|---|---|---|---|---|
| Intercept (β₀) | 2962.14 | 49.42 | 0.000 | Average baseline price level when all predictors are zero. |
| Interest Rate (%) | 8.65 | 1.12 | 0.262 | Positive but insignificant — suggests a mild upward link between rates and prices. |
| GDP Growth (%) | -3.48 | -0.71 | 0.479 | Negative but insignificant — higher GDP growth did not consistently boost stock prices. |
| Inflation Rate (%) | -3.33 | -0.46 | 0.645 | Negative but insignificant — inflation slightly eroded stock value, though the effect is weak. |
Interpretation and Economic Meaning
-
Weak Predictive Power:
The model’s R² = 0.001 implies that macro variables explain less than 1% of stock market movements during this period.
Stock price fluctuations were driven mainly by micro-level and behavioral factors (e.g., corporate performance, investor sentiment, global capital flows). -
Insignificance of Macroeconomic Factors:
All p-values > 0.05 indicate that interest rate, GDP growth, and inflation do not significantly predict short-term price levels.
This aligns with financial theory: in efficient markets, prices often incorporate expectations long before policy changes materialize. -
Positive Interest Rate Coefficient:
While typically negative, the mild positive relationship here may reflect periods when interest rate hikes coincided with strong economic confidence, causing investors to maintain equity exposure. -
Negative GDP and Inflation Effects:
Both variables have negative coefficients, suggesting that high inflation or rapid growth episodes may have introduced volatility or uncertainty rather than stability in stock valuation.
Diagnostic Insights
-
No Autocorrelation:
The Durbin–Watson statistic (1.996) confirms that residuals are independent, validating model assumptions. -
Residual Normality:
Near-zero skewness and low kurtosis indicate residuals are roughly symmetric, suggesting no major model distortion. -
Low Condition Number (24) indicates no severe multicollinearity among predictors.
Economic Interpretation Table
| Economic Variable | Expected Relationship | Observed Sign | Empirical Meaning |
|---|---|---|---|
| Interest Rate | Negative | Slightly Positive | Short-term neutrality — markets absorbed rate changes without major reaction. |
| GDP Growth | Positive | Negative | Stock performance not directly tied to growth — possibly due to external capital flows or speculative bubbles. |
| Inflation | Negative | Negative | Aligns with theory — inflation mildly erodes real returns, but the impact was insignificant. |
Broader Policy and Investment Implications
-
For Policymakers:
The weak model suggests monetary and fiscal signals alone cannot predict stock market direction — structural and behavioral factors dominate. -
For Investors:
Macro indicators are important for long-term valuation, but short-term price action depends on earnings, innovation, and sentiment cycles. -
For Researchers:
Future models could apply Vector Autoregression (VAR) or Cointegration Tests to detect lagged or long-run effects between policy rates, inflation, and stock performance.
The DatalytIQs Academy Insight
At DatalytIQs Academy, we teach learners to bridge theory and evidence.
This regression exemplifies that econometric modeling is not about forcing relationships but testing reality — where data often refutes oversimplified assumptions.
Understanding why relationships appear weak can be more insightful than finding strong ones — it shows that markets evolve with complexity, expectation, and global interdependence.
Source & Acknowledgment
Author: Collins Odhiambo Owino
Institution: DatalytIQs Academy
Dataset: Finance & Economics Dataset (2000–2025), Kaggle.
Source: DatalytIQs Academy Research Repository — compiled from open international macro-financial data (2025).
Key Takeaway
The stock market is not a slave to interest rates or inflation — it’s a mirror of confidence, risk perception, and global capital flow dynamics.
Leave a Reply
You must be logged in to post a comment.