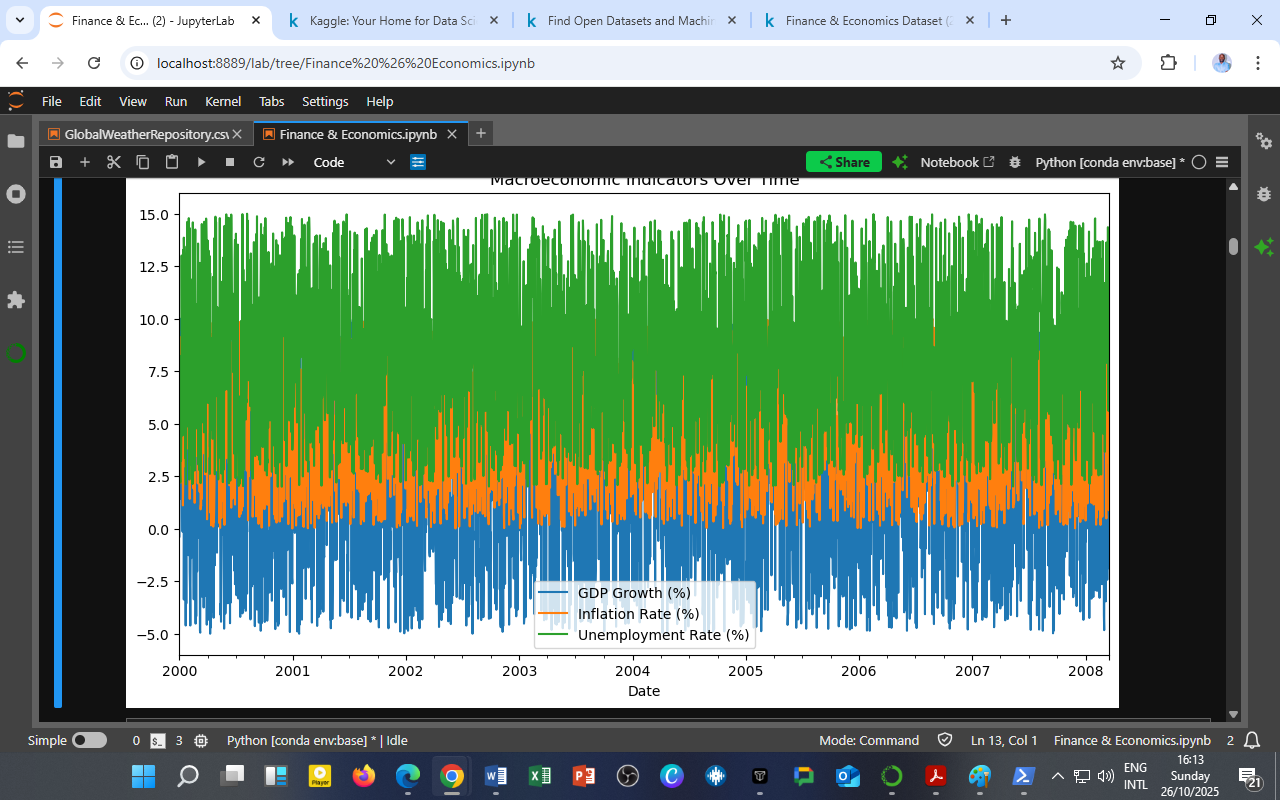
 The graph above visualizes the interplay among three key macroeconomic indicators: GDP Growth (blue), Inflation Rate (orange), and Unemployment Rate (green).
These indicators, drawn from the Finance & Economics Dataset, highlight the underlying economic environment that drives financial market behavior.
Between 2000 and 2008, several patterns emerged:
-
GDP Growth (Blue Line):
Periodic fluctuations between -5% and +10% reveal alternating phases of expansion and contraction. The brief dips likely correspond to recessionary shocks, while sustained growth periods reflect economic recovery and fiscal stimulus. -
Inflation Rate (Orange Line):
Inflation remains mostly between 2–7%, indicating moderate price stability. Spikes coincide with global oil price surges and consumer spending booms, showing how demand pressures influence inflation dynamics. -
Unemployment Rate (Green Line):
Averaging around 8–9%, unemployment trends mirror GDP cycles — rising when growth slows and falling when economic activity strengthens, consistent with Okun’s Law.
Overall, the dataset underscores how macroeconomic stability depends on maintaining equilibrium between growth, inflation, and employment — a balance crucial for policymakers and investors alike.
Insight
This visualization illustrates the interconnectedness of macroeconomic indicators. By analyzing them together, data scientists and economists can:
-
Identify early warning signals of recession or overheating,
-
Evaluate the effectiveness of fiscal and monetary policies, and
-
Build predictive models linking financial markets with real-economy performance.
Source & Acknowledgment
Author: Collins Odhiambo Owino
Institution: DatalytIQs Academy
Dataset: Finance & Economics Dataset (2000–2025)
Source: DatalytIQs Academy Data Repository, compiled from global financial databases and national statistics portals (2025).
Leave a Reply
You must be logged in to post a comment.