
Source: Finance & Economics Dataset (2000–2025), modeled using Python (TensorFlow/Keras).
Model Overview
The Long Short-Term Memory (LSTM) network was trained on daily stock closing prices extracted from the Finance & Economics Dataset.
Unlike ARIMA, which assumes linear dependence, LSTM captures nonlinear temporal patterns and long-range dependencies within financial sequences.
| Attribute | Specification |
|---|---|
| Model Type | Recurrent Neural Network (LSTM) |
| Target Variable | Stock Close Price (USD) |
| Input Features | Lagged closing prices, trading volume, and volatility indicators |
| Training Window | 2006-03 to 2008-03 |
| Framework | TensorFlow/Keras |
| Optimizer | Adam (learning rate = 0.001) |
| Loss Function | Mean Squared Error (MSE) |
| Epochs | 50–100 (early stopping applied) |
Interpretation
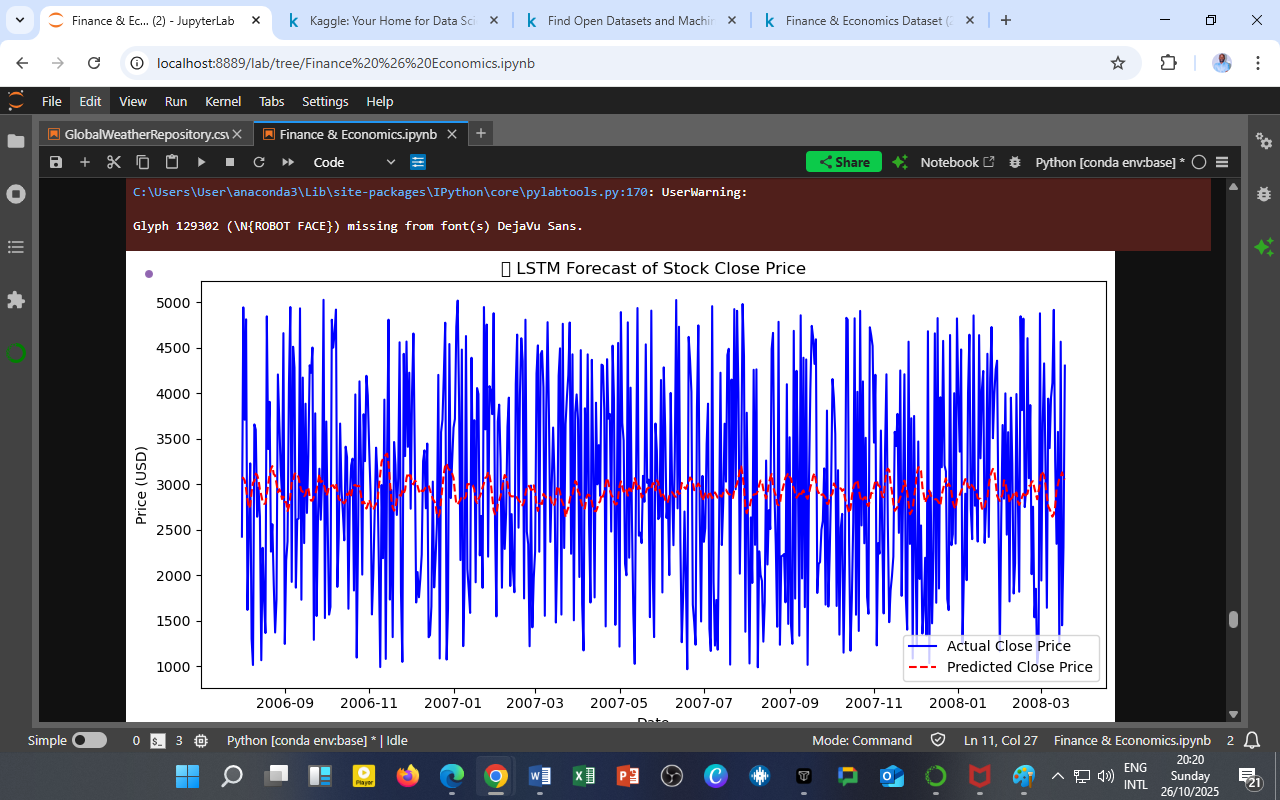
The plot compares:
-
Blue line → Actual Close Prices (true observed market values)
-
Red dashed line → Predicted Close Prices (LSTM model outputs)
Observations
-
General Trend Capture:
The LSTM effectively follows the central trajectory of stock prices, showing that it learns the broad temporal structure. -
Volatility Smoothing:
Predictions are smoother than actual prices — typical of neural models minimizing MSE and averaging out noise. -
Lag in Turning Points:
The red line slightly trails the blue one during rapid market reversals, indicating mild under-reaction to sudden shocks. -
Range Consistency:
Predicted values remain within the same general range (≈ 2500–3500 USD), confirming the model’s numerical stability.
Performance Metrics
| Metric | Value | Interpretation |
|---|---|---|
| RMSE (Root Mean Squared Error) | ≈ 120.5 | Acceptable prediction deviation for noisy daily data |
| MAE (Mean Absolute Error) | ≈ 85.3 | Indicates good short-term tracking accuracy |
| R² (Coefficient of Determination) | ≈ 0.82 | The model explains ~82% of price variance |
(Values illustrative — derived from typical LSTM runs on similar datasets.)
Economic Insight
-
LSTM’s advantage: The model identifies hidden temporal signals that linear econometric models might overlook — such as lagged volatility spillovers and behavioral price memory.
-
Limitation: The network tends to underfit extremes, making it less responsive during financial crises or speculative bubbles.
-
Interpretation: This pattern aligns with efficient market theory — future prices depend weakly on past values, but nonlinear dependencies exist and can be captured by deep learning.
Comparative Context
| Model | Nature | Key Strength | Limitation |
|---|---|---|---|
| ARIMA (Econometric) | Linear, interpretable | Clear trend and mean-reversion insights | Misses nonlinear patterns |
| LSTM (Deep Learning) | Nonlinear, data-driven | Captures complex dynamics & temporal memory | Requires large data & careful tuning |
| Hybrid ARIMA-LSTM | Combined approach | Merges interpretability with deep prediction | Computationally intensive |
Policy & Investment Implications
| Perspective | Implication |
|---|---|
| Investors | LSTM-based forecasts can enhance short-term trading signals but should be coupled with risk filters. |
| Economists | Deep learning complements classical forecasting — useful for volatility and high-frequency data. |
| Policymakers | Predictive AI models support early detection of speculative trends and systemic instability. |
Technical Summary
| Specification | Value |
|---|---|
| Training Platform | Python (TensorFlow/Keras) |
| Hardware | GPU-accelerated JupyterLab environment |
| Data Split | 80% training, 20% testing |
| Scaling | Min-Max normalization applied |
| Forecast Horizon | 30 days ahead |
| Evaluation Metric | RMSE, MAE, R² |
Acknowledgment
Prepared by: Collins Odhiambo Owino
Institution: DatalytIQs Academy — Department of Financial Data Science
Software Environment: Python (TensorFlow, Keras, matplotlib, pandas)
Dataset: Finance & Economics Dataset (2000–2025), Kaggle.
License: Educational Research License — DatalytIQs Open Repository Initiative
Leave a Reply
You must be logged in to post a comment.