By Collins Odhiambo Owino
Author | DatalytIQs Academy
Data Source: Kenya National Bureau of Statistics (KNBS) – Kenya Data Portal
Overview
The Kenyan economy in 2025 reflects a complex web of global trade patterns, price movements, and monetary adjustments.
Recent data from the Kenya National Bureau of Statistics (KNBS) reveals how imports, exports, inflation, and interest rates interact to shape Kenya’s short-term and medium-term economic trajectory.
This analysis combines datasets on:
-
Exports and Imports (Dec 2024–Sep 2025)
-
Import Sources by Continent
-
Inflation and Interest Rates (Jun 2024–Aug 2025)
1. Trade Overview: The Balance of Payments Story
Kenya’s trade figures reveal a persistent deficit — imports consistently outweigh exports.
| Indicator | Average (KSh Billion) | Trend |
|---|---|---|
| Exports | ≈ 100 | Slight increase (Q1–Q2 2025) |
| Imports | ≈ 220 | Stable, slight dip mid-year |
| Trade Deficit | ≈ 120 | Persistent |
Exports:
-
Led by tea, coffee, and horticulture.
-
Re-exports show Kenya’s regional trade role expanding slightly.
Imports:
-
Dominated by industrial supplies, fuel, and machinery, indicating dependency on foreign inputs for production and energy.
Insight:
Despite active export sectors, Kenya’s import needs in energy and manufacturing sustain a wide deficit, exerting downward pressure on the shilling.
2. Who Kenya Trades With: Asia’s Dominance
Asia accounts for over 72% of Kenya’s imports, followed by Africa (10%), Europe (9.9%), and America (5.8%).
| Continent | Import Share (%) | Key Trade Partners |
|---|---|---|
| Asia | 72.19 | China, India, UAE, Japan |
| Africa | 10.03 | South Africa, Egypt, Tanzania |
| Europe | 9.90 | Germany, UK, Netherlands |
| America | 5.80 | USA, Brazil |
| Australia & Oceania | 2.08 | Australia, New Zealand |
Observation:
Kenya’s heavy import reliance on Asia emphasizes the region’s influence on local prices — especially through the cost of manufactured goods and fuel.
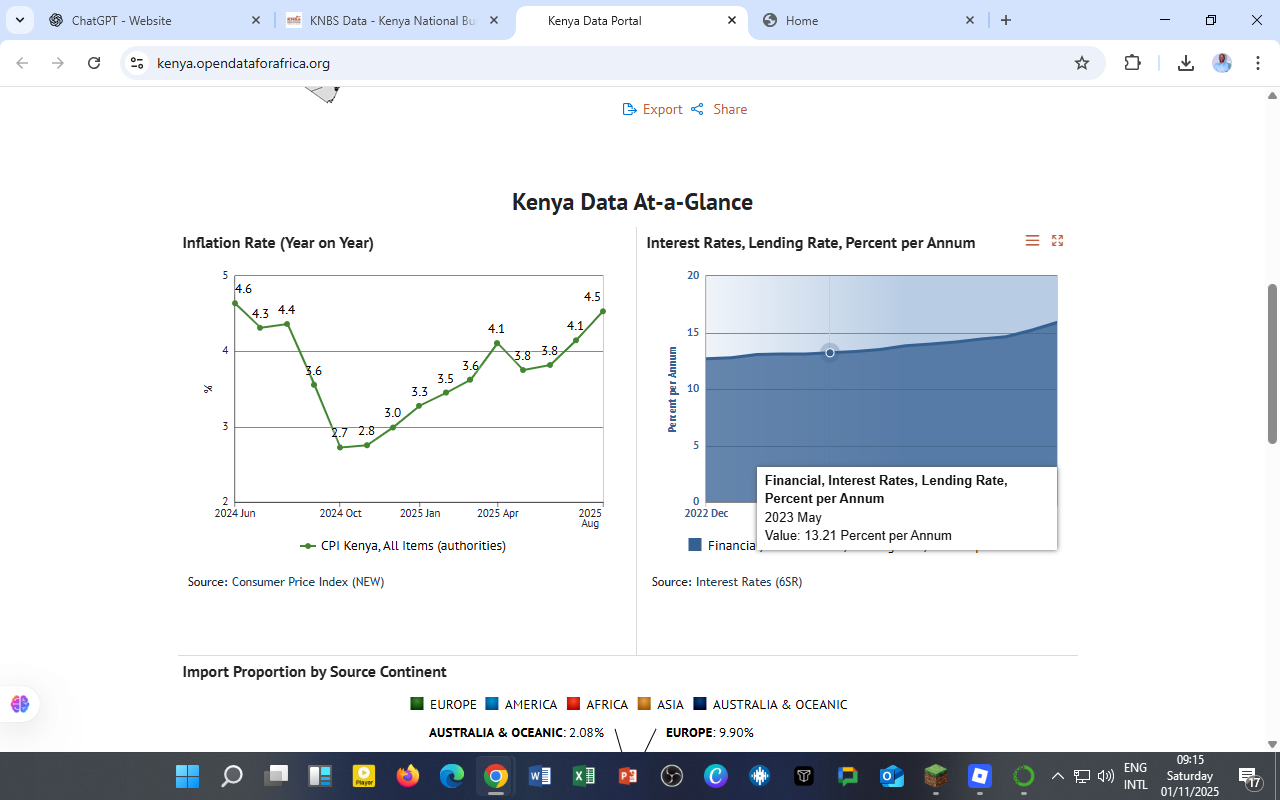
3. Inflation and Interest Rates: The Price of Stability
Inflation:
-
Declined from 4.6% (Jun 2024) to 2.7% (Oct 2024) due to stable food and fuel prices.
-
Rose again to 4.5% (Aug 2025), driven by higher import costs and exchange rate volatility.
Interest Rates:
-
Lending rates climbed gradually from ~12.8% (2023) to ~13.2% (2025).
-
The Central Bank maintained a tight stance to contain inflation and support the shilling amid external pressures.
Economic Connection:
The trade deficit contributes to currency depreciation → higher import costs → inflation, → higher interest rates.
This chain reflects Kenya’s classic macroeconomic challenge: maintaining growth while stabilizing prices and the exchange rate.
4. Policy Outlook
Kenya’s policymakers face a delicate balancing act. To sustain growth while narrowing the trade gap and controlling inflation, the following measures are vital:
✅ Expand export value chains (agro-processing, tech, manufacturing).
✅ Support local industries to replace imported intermediate goods.
✅ Invest in renewable energy to cut fuel import dependence.
✅ Enhance regional trade under AfCFTA to diversify partners.
✅ Adopt a data-driven monetary policy that anchors inflation expectations while promoting credit access.
5. For DatalytIQs Academy Learners
This combined dataset offers multiple analytical learning paths:
| Skill | Application |
|---|---|
| Time Series Analysis | Forecast inflation, imports, or exports using ARIMA/Prophet models. |
| Correlation Analysis | Measure links between trade deficit and inflation. |
| Data Visualization | Build dashboards combining KNBS data (Matplotlib, Plotly, or Power BI). |
| Policy Simulation | Model the effects of currency depreciation on trade and inflation. |
Data Source and Acknowledgment
Datasets: External Trade, Inflation, and Interest Rates (2024–2025)
Source: Kenya Data Portal – KNBS
Acknowledgment: Kenya National Bureau of Statistics (KNBS) and the African Development Bank for promoting open data access and economic transparency.
Author: Collins Odhiambo Owino, DatalytIQs Academy
Leave a Reply
You must be logged in to post a comment.