https://www.youtube.com/live/exTDo4AFdsM?si=pIr32Dr66bbZZtbg
Visual Insight
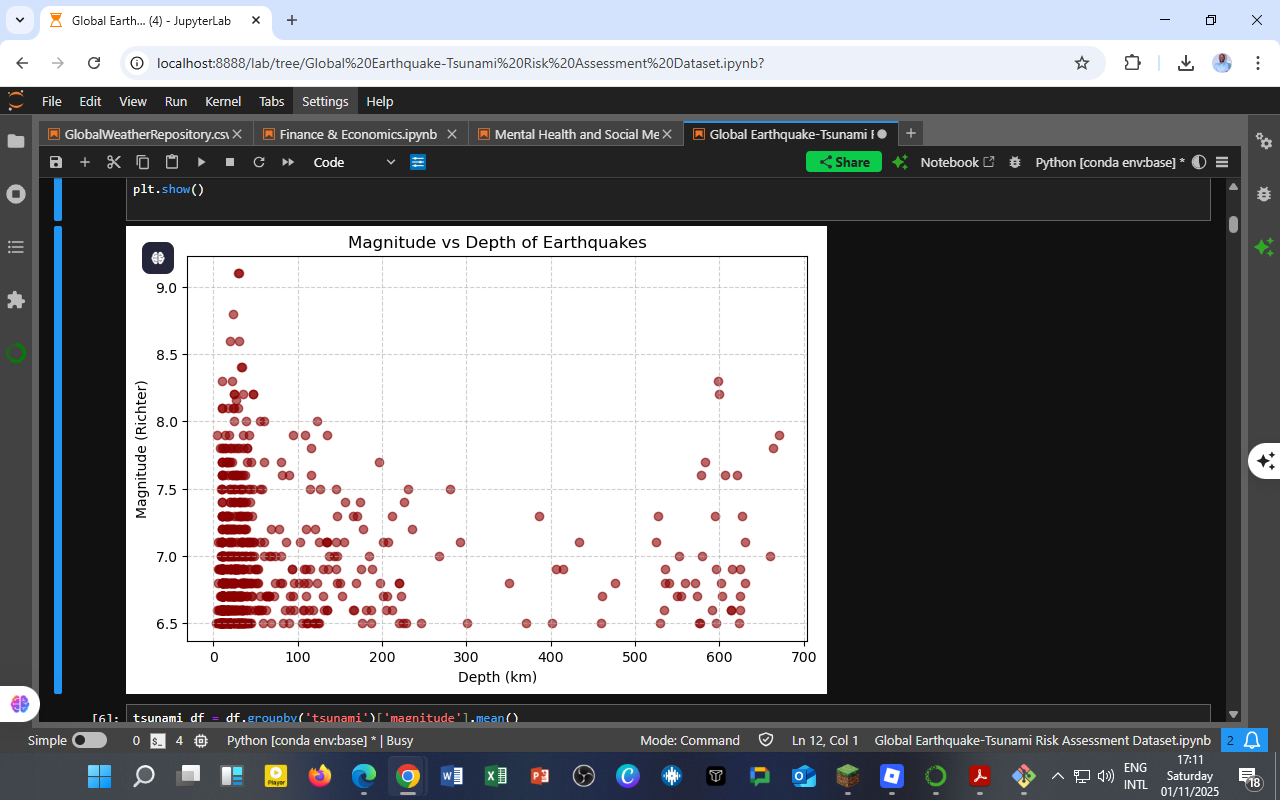
The figure above shows a scatter plot of Magnitude vs Depth of Earthquakes, part of a broader global earthquake–tsunami risk assessment study. Each point represents an earthquake event, plotted by its depth (in km) on the x-axis and magnitude (Richter scale) on the y-axis.
From the visualization, we observe that:
-
Most high-magnitude earthquakes (≥7.0) occur at shallower depths (≤100 km).
-
Deep-focus earthquakes (≥500 km) tend to have moderate magnitudes, rarely exceeding 8.0.
-
The clustering near the surface suggests that tectonic stress is more likely to release energy violently when close to the crust, where rocks are brittle.
This pattern provides valuable insight into global seismic risks—shallow, high-magnitude quakes are often the most destructive, especially when occurring near populated coastal regions.
Scientific Context
In seismology, the relationship between magnitude and depth is crucial for understanding the potential for surface damage and tsunami generation.
-
Shallow earthquakes (<70 km) often cause extensive surface damage.
-
Intermediate-depth events (70–300 km) dissipate energy before reaching the surface.
-
Deep-focus earthquakes (>300 km) rarely cause tsunamis but offer important clues about subduction zone dynamics.
Understanding these dynamics helps in building resilient infrastructure and improving early warning systems in earthquake-prone regions.
Educational Value
This analysis is part of the Global Earthquake–Tsunami Risk Assessment Dataset Project, aimed at integrating geophysical data with machine learning and risk analytics to support predictive modeling. It’s an excellent resource for:
-
Students studying Geophysics, Environmental Risk Analysis, or Earth Science Statistics
-
Policy makers assessing disaster preparedness and resilience
-
Data enthusiasts exploring real-world natural hazard analytics
Acknowledgment
This work was conducted by DatalytIQs Academy, a digital learning and research platform empowering students and professionals in Mathematics, Economics, and Earth Science Analytics.
Data were sourced from the Kaggle Global Earthquake Dataset, analyzed using Python (Pandas, Matplotlib, Seaborn) within JupyterLab.
Contributions and insights from the global data science community are gratefully acknowledged.
Author
Collins Odhiambo Owino
Founder — DatalytIQs Academy
“Empowering global learners through data-driven insight.”
Leave a Reply
You must be logged in to post a comment.