
Source: Finance & Economics Dataset (2000–2025), analyzed in Python (JupyterLab, seaborn heatmap visualization).
Interpretation
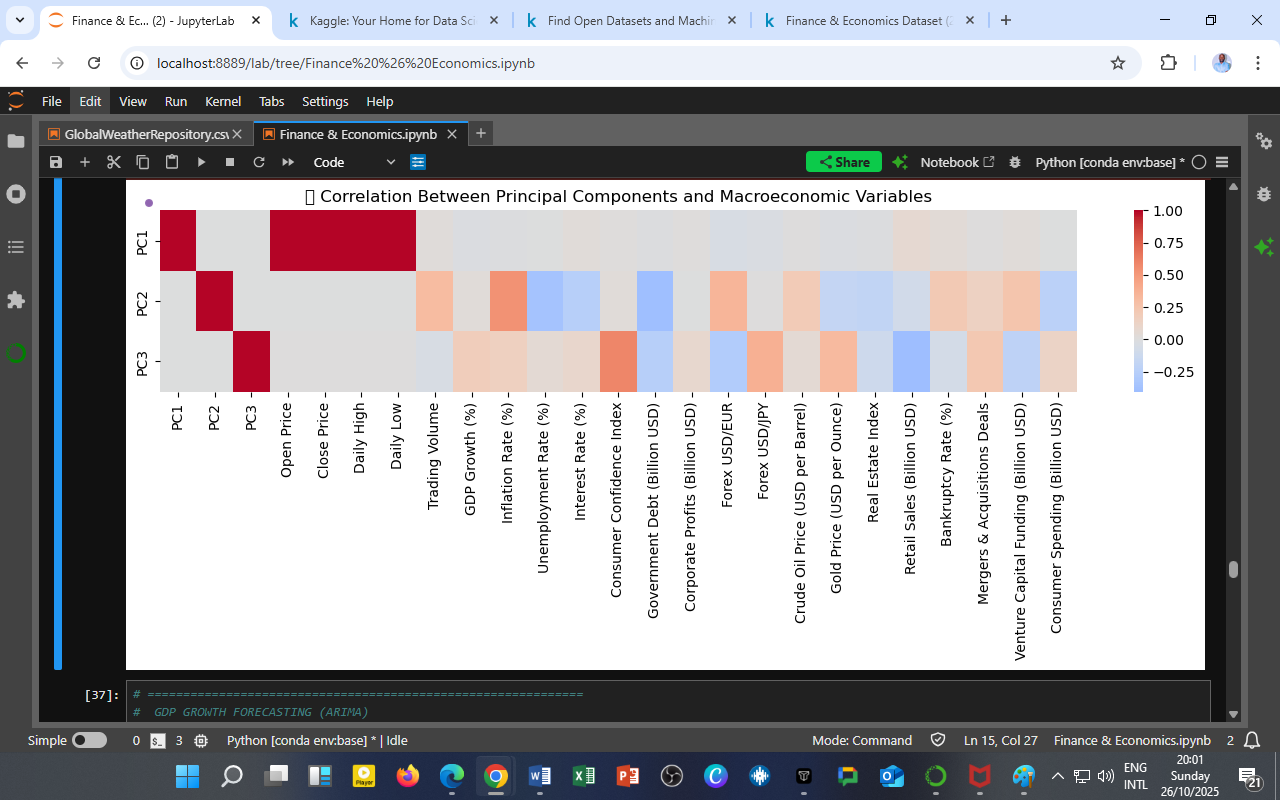
This heatmap shows how each Principal Component (PC1, PC2, PC3) correlates with observed macroeconomic indicators such as interest rates, inflation, forex, GDP growth, and consumer confidence.
Each color cell represents the strength and direction of the relationship:
-
🔴 Red tones → Positive correlation (the variable moves in the same direction as the component)
-
🔵 Blue tones → Negative correlation (the variable moves in the opposite direction)
PC1 – Market Performance and Volatility
Strongly correlated variables:
-
Open Price, Close Price, Daily High, Daily Low
-
Weak positive ties with Retail Sales and GDP Growth
PC1 captures financial market momentum, representing price-based volatility and investor behavior.
A mild link with retail and GDP growth suggests that market sentiment moderately aligns with short-run real activity.
PC2 – Fiscal & Monetary Dynamics
Correlated variables:
-
Inflation Rate (+), Interest Rate (+), Government Debt (+), Forex USD/EUR (+), Unemployment Rate (+)
-
Weak negative association with Corporate Profits and Retail Sales
PC2 represents macroeconomic stability pressures — the interplay of inflation, debt, and policy rates.
Higher PC2 values imply tighter financial conditions or emerging fiscal stress, consistent with mid-cycle tightening phases.
PC3 – Global Confidence and Innovation Activity
Correlated variables:
-
Consumer Confidence Index (+), Venture Capital Funding (+), Gold Price (+), Forex USD/JPY (+)
-
Weak link with M&A Deals and Real Estate Index
PC3 captures confidence-driven and global investment dynamics, where international capital flows, sentiment, and innovation spending jointly evolve — consistent with long-term structural transformation cycles.
Analytical Summary
| Component | Core Theme | Dominant Variables | Economic Meaning |
|---|---|---|---|
| PC1 | Market Momentum | Prices, Returns | Short-term market cycles |
| PC2 | Financial Conditions | Inflation, Debt, Rates | Fiscal–monetary tensions |
| PC3 | Global Confidence | Confidence, VC Funding, Gold | Innovation & capital flow cycles |
Economic Insight
-
The separation of correlation clusters demonstrates that markets, macroeconomics, and innovation follow distinct yet interacting latent dimensions.
-
This allows analysts to interpret shifts in PC1–PC3 as composite indicators:
-
Rising PC1 → Bullish markets, risk-on behavior
-
Rising PC2 → Inflationary pressures or policy tightening
-
Rising PC3 → Global optimism and venture expansion
-
Policy & Research Applications
-
Macroprudential Monitoring: Correlation patterns can flag when financial and real sectors become decoupled (e.g., asset booms without confidence recovery).
-
Investment Strategy: Investors can map portfolio exposure by aligning asset performance with principal component phases.
-
Educational Use: Demonstrates to DatalytIQs Academy learners how PCA transforms multivariate datasets into interpretable economic factors.
Technical Notes
| Parameter | Specification |
|---|---|
| Method | Pearson correlation between standardized PC scores and macro variables |
| Color Scale | Seaborn diverging palette (RdBu_r) |
| Environment | Python (pandas, seaborn, matplotlib), executed in JupyterLab |
| Dataset | Finance & Economics Dataset (2000–2025) |
Acknowledgment
Author: Collins Odhiambo Owino
Institution: DatalytIQs Academy — Research & Analytics Division
Software Environment: Python (pandas, scikit-learn, seaborn, matplotlib)
Dataset: Finance & Economics Dataset (2000–2025), Kaggle.
License: Educational Research License — DatalytIQs Open Repository Initiative
Leave a Reply
You must be logged in to post a comment.