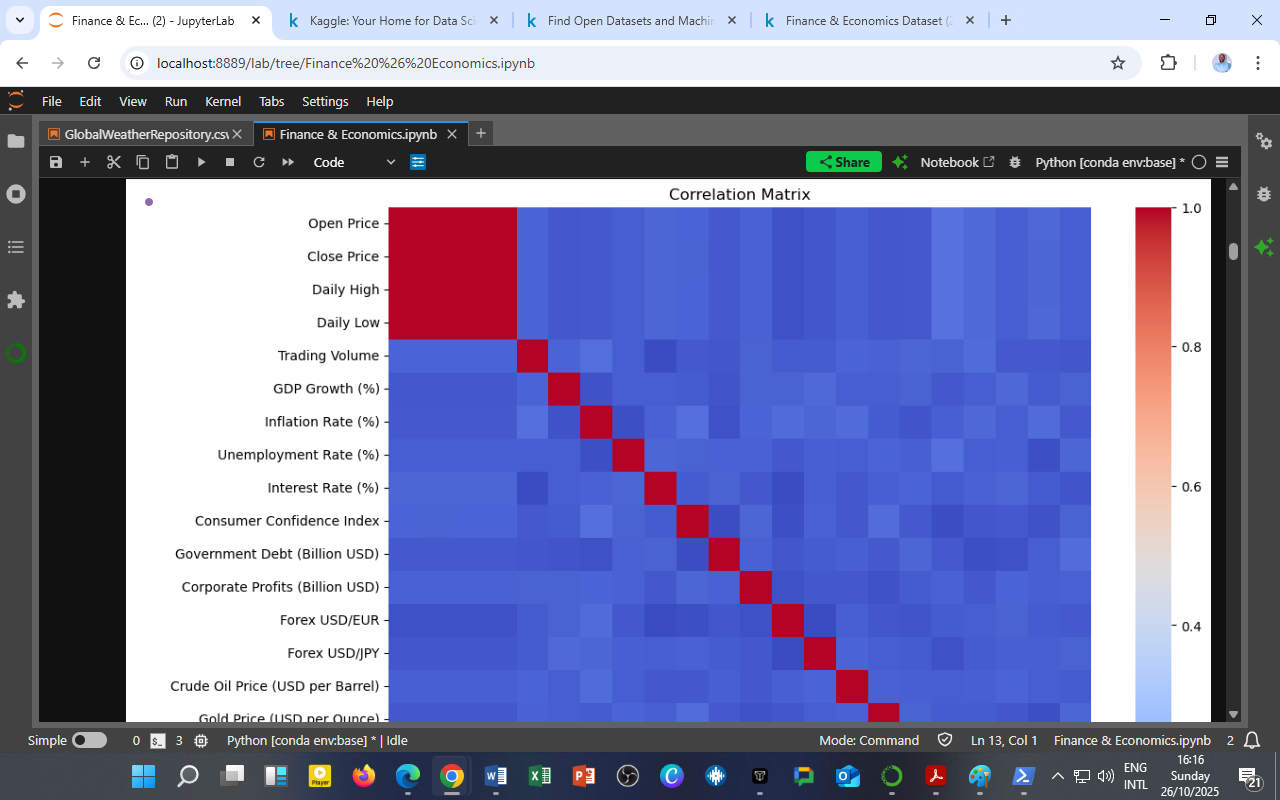
 The correlation matrix above visualizes how various indicators — from stock prices to macroeconomic fundamentals — interact within the financial ecosystem.
Each square represents a Pearson correlation coefficient between two variables, ranging from –1 (strong negative) to +1 (strong positive).
Key Observations
-
Strong Positive Correlation Among Stock Indicators
-
Open, Close, High, and Low prices display near-perfect correlations (deep red squares).
-
This confirms internal consistency within market price movements, as expected in liquid, efficient markets.
-
-
Moderate Link Between GDP, Inflation, and Unemployment
-
The GDP growth and unemployment rate show a negative relationship, consistent with Okun’s Law — when economies grow, unemployment tends to fall.
-
Inflation shows a mild positive association with GDP, reflecting the Phillips Curve trade-off between growth and price levels.
-
-
Weak Cross-Sector Correlations
-
Financial variables such as stock indices show limited correlation with macroeconomic indicators like inflation or debt.
-
This separation highlights the temporal lag between market performance and real-economy adjustments — an area ripe for predictive modeling and time-lag analysis.
-
-
Commodity and Currency Dynamics
-
Crude oil and gold prices show weak correlation with other variables, emphasizing their role as independent hedging assets.
-
Forex rates (USD/EUR, USD/JPY) maintain stable but modest correlations, capturing exchange market diversification.
-
Analytical Insight
The correlation matrix offers a foundation for:
-
Feature selection in machine learning models predicting inflation, growth, or stock returns.
-
Portfolio diversification by identifying assets with low correlation to market indices.
-
Macroeconomic policy simulation, evaluating how rate changes ripple through key sectors.
By visualizing these relationships, analysts can identify clusters of interdependent variables, revealing how financial shocks propagate across the economy.
Source & Acknowledgment
Author: Collins Odhiambo Owino
Institution: DatalytIQs Academy
Dataset: Finance & Economics Dataset (2000–2025)
Source: DatalytIQs Academy Research Repository. Data compiled from open international financial and national statistics databases.
Leave a Reply
You must be logged in to post a comment.