Understanding the Primary Balance
The primary balance measures the difference between a government’s revenues and non-interest expenditures — expressed as a percentage of GDP.
It indicates whether a country’s fiscal policy is expansionary (deficit) or consolidating (surplus).
The chart below tracks fiscal positions for selected economies across four periods:
-
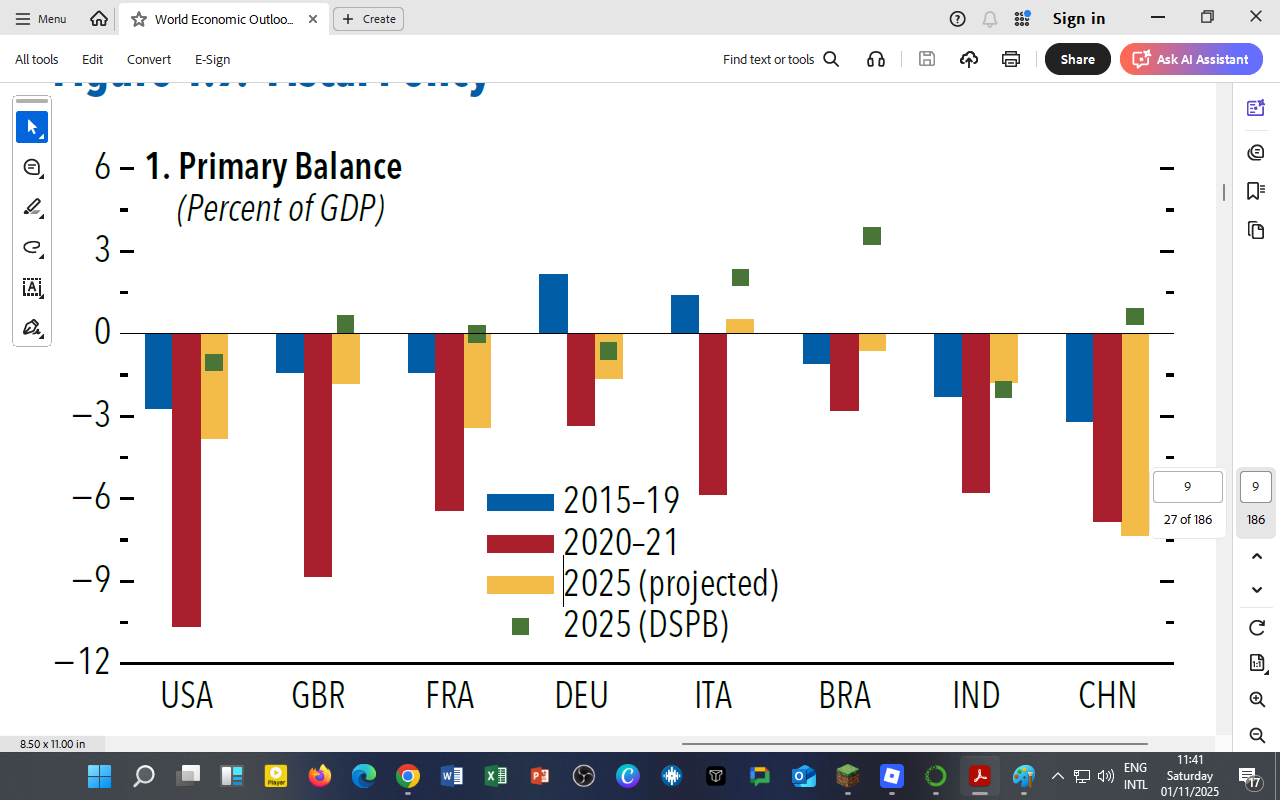
2015–19 (blue): Pre-COVID baseline years
-
2020–21 (red): Pandemic-related fiscal stimulus
-
2025 (projected, yellow): Medium-term fiscal adjustment path
-
2025 (DSPB, green): “Debt-Stabilizing Primary Balance” — the level needed to keep debt ratios constant
Figure — Primary Balance (% of GDP)

Countries covered: USA, GBR, FRA, DEU, ITA, BRA, IND, CHN
Fiscal Storyline
1. 2015–19: Stability and Modest Deficits
Before the pandemic, most economies maintained small primary deficits (–1 % to –3 % of GDP). Fiscal positions were broadly sustainable, anchored by low interest rates and moderate debt levels.
2. 2020–21: The Pandemic Shock
All major economies experienced historic fiscal deterioration as governments launched unprecedented support packages.
-
The United States and the United Kingdom ran double-digit primary deficits (–9 % to –10 %).
-
France, Italy, and India recorded severe slippages due to health and social spending.
-
China and Brazil also loosened fiscal policy aggressively to cushion demand.
3. 2025: Gradual Consolidation but Uneven Progress
-
Fiscal balances have improved but remain below pre-pandemic levels.
-
Germany (DEU) returns close to surplus, reflecting disciplined fiscal management.
-
Italy and France continue to run moderate deficits, while Brazil and India maintain expansionary stances to support growth.
-
China’s projected primary deficit near –5 % of GDP highlights persistent stimulus to sustain domestic demand.
Most countries have yet to reach the Debt-Stabilizing Primary Balance (DSPB), meaning public-debt ratios will keep rising unless further adjustments occur.
Fiscal Trade-Offs in 2025
| Policy Objective | Fiscal Implication | Examples |
|---|---|---|
| Growth Support | Slower consolidation to sustain demand. | India, Brazil |
| Debt Sustainability | Tighter fiscal policy and expenditure cuts. | Germany, UK |
| Social Stability | Protecting welfare spending despite debt pressures. | France, China |
| Green & Digital Investment | Redirecting budgets toward long-term transformation. | EU economies |
The global fiscal debate has shifted from stimulus to sustainability — finding the delicate balance between economic recovery and debt control.
Implications for Africa and Kenya
-
Kenya, like many emerging economies, faces a post-COVID debt overhang with rising interest payments and constrained fiscal space.
-
The primary deficit is near –3.5 % of GDP (2025 projection), suggesting limited progress toward debt stabilization.
-
Fiscal reforms, improved tax administration, and targeted subsidies will be crucial to align Kenya’s primary balance with growth priorities.
-
Lessons from Germany’s fiscal prudence and Brazil’s targeted social spending offer useful models.
A primary balance close to zero is essential for long-term debt sustainability, especially where interest costs are high.
For DatalytIQs Academy Learners
You can extend this analysis by:
-
Recreating the stacked-period bar chart in Python/Matplotlib to visualize fiscal evolution.
-
Calculating Kenya’s debt-stabilizing primary balance using the formula:
where r = interest rate and g = GDP growth.
-
Comparing IMF projections with the Kenya National Treasury’s 2025 Budget Policy Statement.
Data and Acknowledgment
Source: IMF World Economic Outlook (October 2025), Figure 1.9 – “Primary Balance (% of GDP)”
Acknowledgment: IMF Fiscal Affairs Department and Haver Analytics for data compilation.
Author: Collins Odhiambo Owino, DatalytIQs Academy
Leave a Reply
You must be logged in to post a comment.