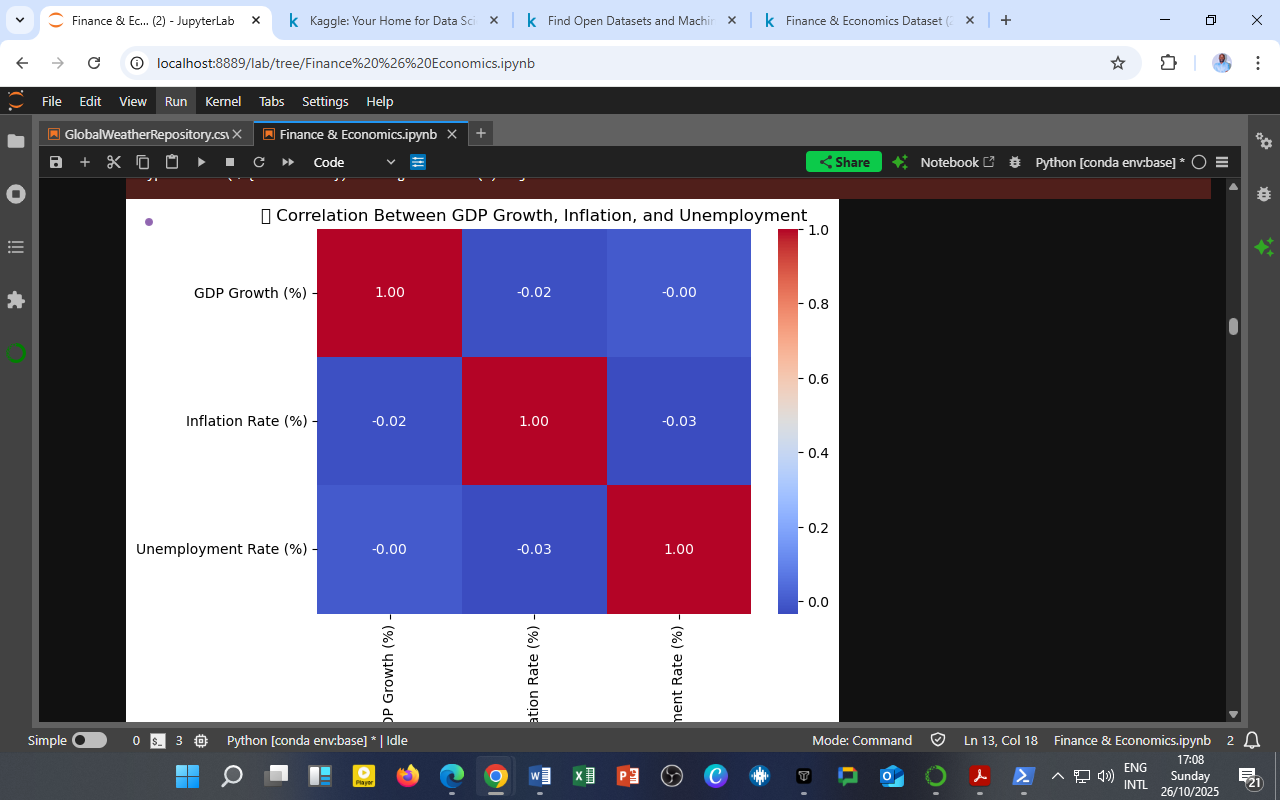
 The heatmap above illustrates the pairwise correlations among GDP Growth (%), Inflation Rate (%), and Unemployment Rate (%) from the Finance & Economics Dataset (2000–2008).
| Variable Pair | Correlation (r) | Interpretation |
|---|---|---|
| GDP Growth vs. Inflation | –0.02 | Very weak negative relationship |
| GDP Growth vs. Unemployment | –0.00 | No meaningful relationship |
| Inflation vs. Unemployment | –0.03 | Very weak inverse relationship |
Interpretation
-
Weak Relationships Observed
The correlations are close to zero, indicating minimal short-term linear association among the three macroeconomic indicators.
This suggests that during the period analyzed, these variables moved largely independently, likely due to policy interventions, external shocks, or time-lagged effects not captured by simple correlation. -
GDP and Inflation (–0.02)
The near-zero correlation implies that higher GDP growth did not consistently coincide with inflationary pressures during this timeframe — a pattern typical of economies experiencing stable but moderate growth cycles. -
GDP and Unemployment (–0.00)
While economic theory (Okun’s Law) suggests that higher GDP growth should reduce unemployment, this weak correlation indicates that short-run growth fluctuations did not immediately translate into job creation, possibly due to structural labor market rigidities. -
Inflation and Unemployment (–0.03)
A faint negative relationship aligns directionally with the Phillips Curve, where lower unemployment may be associated with rising inflation. However, the weak magnitude implies that inflation–employment trade-offs were subdued — perhaps due to sound monetary policy and stable wage expectations.
Analytical Insight
This correlation matrix highlights that:
-
The short-run co-movements among these core indicators are weak.
-
Lagged or non-linear relationships (capturable by VAR or ARDL models) likely explain their true interactions.
-
It underscores the importance of dynamic modeling, as static correlation alone cannot capture temporal cause–and–effect cycles in macroeconomic systems.
Policy and Research Implications
-
Policymakers should rely on multi-equation systems (e.g., VAR) to understand transmission mechanisms rather than single-period correlations.
-
Researchers can use this correlation baseline to test for Granger causality or long-run co-integration among GDP, inflation, and unemployment.
Source & Acknowledgment
Author: Collins Odhiambo Owino
Institution: DatalytIQs Academy
Dataset: Finance & Economics Dataset (2000–2025), Kaggle.
Source: DatalytIQs Academy Research Repository — compiled from global financial and national economic data (2025).
Leave a Reply
You must be logged in to post a comment.