What Is Core Inflation?
Core inflation measures the underlying trend in prices by excluding volatile food and energy items. It reflects the true persistence of inflation within an economy — often driven by wages, housing, services, and expectations.
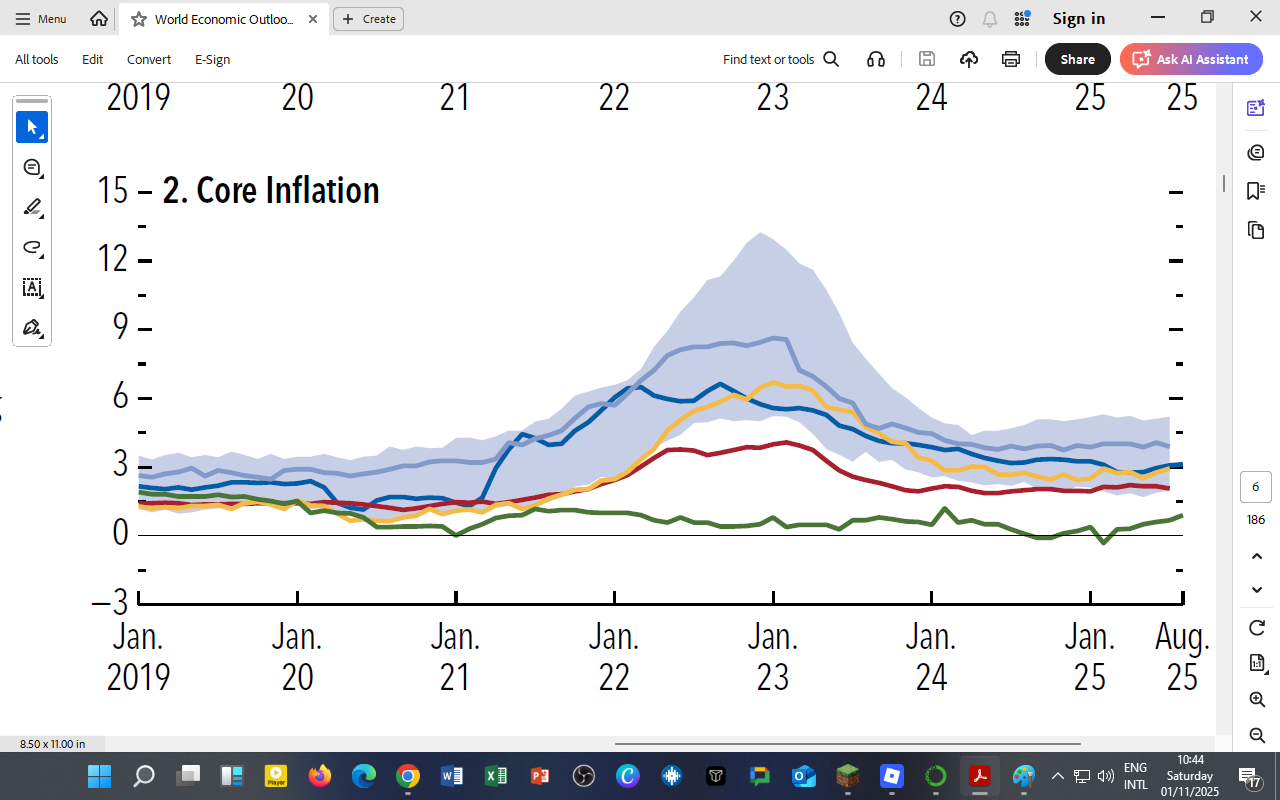
The IMF’s latest Core Inflation chart tracks five major groups:
-
United States (blue)
-
Euro Area (red)
-
Other Advanced Economies (AEs) (gold)
-
China (green)
-
Other Emerging and Developing Economies (EMDEs) (blue band)
Recent Trends (2019 – 2025)

Key observations:
-
Global Peak (2022–23):
-
Core inflation rose above 6 % in advanced economies, driven by pandemic-era demand surges, supply bottlenecks, and energy shocks.
-
EMDEs experienced broader dispersion — some exceeding 12 % — reflecting food insecurity and currency depreciation.
-
-
Gradual Easing (2024–25):
-
U.S. and Euro Area core inflation declined but remains well above central-bank targets (≈ 2 %).
-
The Euro Area’s slower descent underscores the stickiness of services inflation and wage adjustments.
-
-
China’s Subdued Path:
-
Inflation stayed under 2 % throughout, reflecting excess capacity, muted demand, and deflationary pressures.
-
The “last mile” of disinflation is proving the hardest — prices of non-tradables (rent, health, transport services) are still rising faster than goods prices.
Policy Dilemmas for 2025
| Challenge | Advanced Economies | Emerging Economies |
|---|---|---|
| Wage Persistence | Tight labor markets keep service inflation high. | Wages lag inflation; real incomes are still recovering. |
| Interest Rates | Central banks keep policy rates “higher for longer.” | Selective easing to support growth, balanced against FX risks. |
| Fiscal Space | Limited — focus on debt stabilization. | High debt service burdens constrain subsidies and social spending. |
| Inflation Expectations | Anchored but fragile. | Vulnerable to exchange-rate and food-price shocks. |
The IMF warns that premature easing could reignite inflation, but excessive tightening may undermine growth and financial stability.
Implications for Africa and Kenya
-
Kenya’s core inflation (≈ 4.5 %) tracks global averages but remains within the CBK’s target band.
-
Domestic fuel price reforms and better food supply chains helped contain pressures.
-
A stronger shilling and CBK’s 9.25 % policy rate support price stability.
-
The “imported inflation channel” has weakened as global commodity prices fall.
Insight for Students:
Kenya’s price dynamics mirror the global core trend — slower to fall than headline inflation. It demonstrates how domestic wages, services, and expectations sustain inflation momentum.
For DatalytIQs Academy Learners
You can extend this analysis by coding your own core inflation visualization:
-
Use
matplotlib.pyplot.fill_between()to recreate the blue band for EMDE uncertainty. -
Overlay Kenya’s KNBS core CPI data to compare with global trends.
-
Compute rolling averages to detect when disinflation began locally versus globally.
Data and Acknowledgment
Source: IMF World Economic Outlook (October 2025) – Figure 1.6 “Core Inflation.”
Acknowledgment: IMF staff for open data on global price trends and inflation analytics.
Author: Collins Odhiambo Owino, DatalytIQs Academy
Leave a Reply
You must be logged in to post a comment.