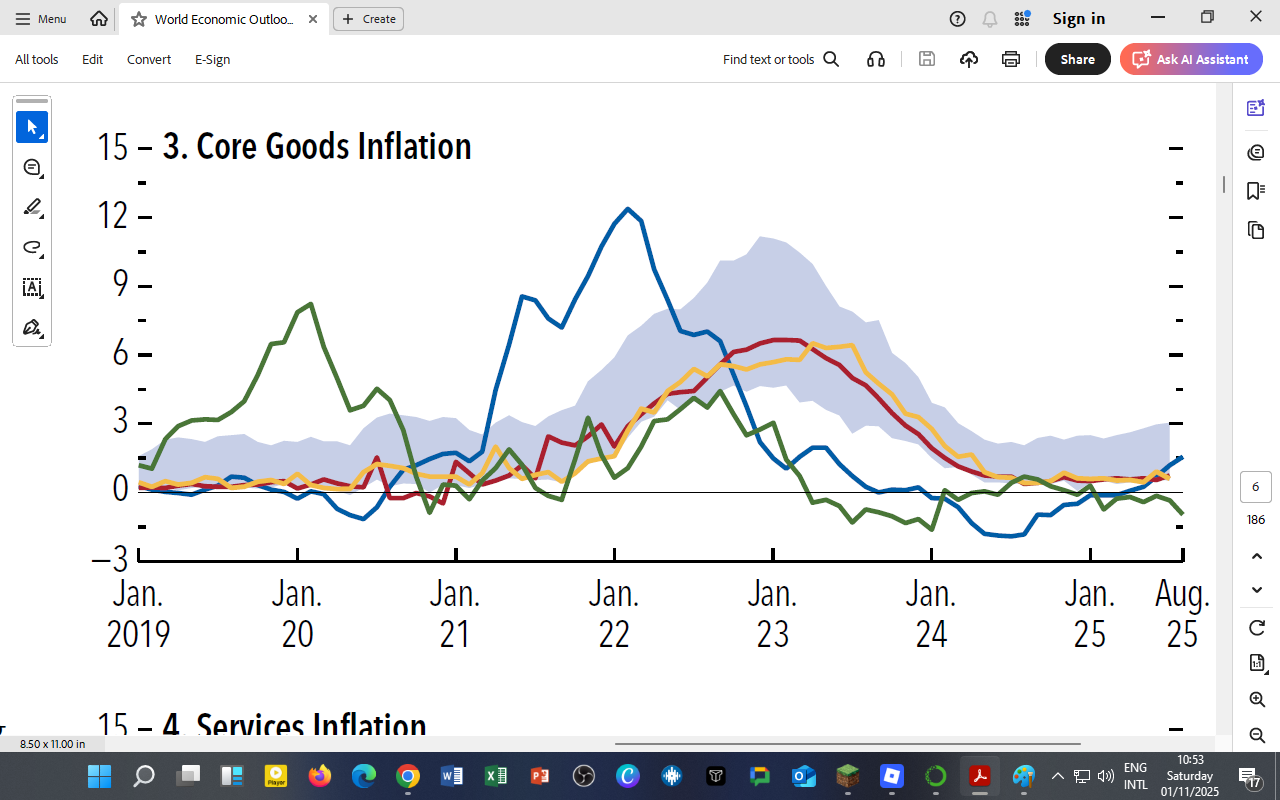
Understanding Core Goods Inflation
Core goods inflation isolates price changes in non-food, non-energy manufactured goods — such as cars, electronics, clothing, and household items. It reflects global supply chains, shipping costs, and industrial demand rather than local food or fuel shocks.
IMF data (2019–2025) compares trends across:
-
United States (blue)
-
Euro Area (red)
-
Other Advanced Economies (AEs) (gold)
-
China (green)
-
Other Emerging and Developing Economies (EMDEs) (light blue band)
Global Patterns in Core Goods Inflation

1. The Pandemic Supply Shock (2020–2022):
-
Inflation in goods surged worldwide due to supply-chain disruptions, logistics bottlenecks, and a spike in shipping costs.
-
The United States saw the sharpest rise, peaking above 12 % in 2022 as stimulus-driven demand collided with scarce inventories.
-
China’s inflation fluctuated widely, rising early due to domestic lockdown cycles, then falling sharply amid manufacturing overcapacity.
-
Euro Area and Other Advanced Economies followed similar paths but with smaller amplitudes.
2. The Decline (2023–2025):
-
As supply chains normalized and global freight costs dropped, goods inflation fell rapidly.
-
By 2025, most advanced economies saw rates return to around 1–2 %, consistent with pre-pandemic norms.
-
EMDEs retained greater volatility due to exchange-rate depreciation and dependence on imported manufactured goods.
This “goods disinflation” marks the clearest victory in the global fight against inflation — but it also hides persistent pressures in services and housing, which now dominate inflation drivers.
Structural Forces Behind Goods Disinflation
| Factor | Description | Economic Impact |
|---|---|---|
| Supply-Chain Normalization | Global shipping, ports, and chip supplies recovered by late 2023. | Lower producer and retail prices. |
| Commodity Price Moderation | Oil, metals, and fertilizers stabilized below 2022 peaks. | Reduced input costs. |
| Demand Rotation | Consumers shifted from goods to services post-pandemic. | Dampened goods demand. |
| Monetary Tightening | Higher interest rates curbed credit-financed purchases (cars, appliances). | Softened retail inflation. |
Goods inflation is largely under control, but the IMF cautions that energy transitions, re-shoring, and new trade tariffs could reintroduce cost pressures later in the decade.
Implications for Africa and Kenya
-
Kenya’s imported inflation has eased with lower global goods prices, stabilizing consumer costs for manufactured imports.
-
Local manufacturing still faces high logistics and input costs, limiting full transmission of global disinflation.
-
Policies that promote domestic industrial capacity and regional value chains can help shield against future supply shocks.
Kenya’s experience shows how open economies import both inflation and disinflation, emphasizing why macroeconomic management must align with global production cycles.
For DatalytIQs Academy Learners
Students can extend this dataset into applied learning exercises:
-
Plot core goods vs. core services inflation to visualize divergence.
-
Apply time-series decomposition to isolate supply shocks (2020–22) and recovery phases (2023–25).
-
Model inflation pass-through using exchange-rate data for Kenya and other Sub-Saharan economies.
Data and Acknowledgment
Source: IMF World Economic Outlook (October 2025) – Figure 1.6 (3) “Core Goods Inflation.”
Acknowledgment: IMF staff and World Bank trade data teams for open-access economic visualizations.
Author: Collins Odhiambo Owino, DatalytIQs Academy
Leave a Reply
You must be logged in to post a comment.