
Kenya’s Economic Dashboard 2025: Trade, Inflation, and the CBK’s Balancing Act
By Collins Odhiambo OwinoAuthor | DatalytIQs AcademyData Sources: Kenya National Bureau of Statistics (KNBS), Central Bank of Kenya (CBK), and the Kenya Data Portal. Overview
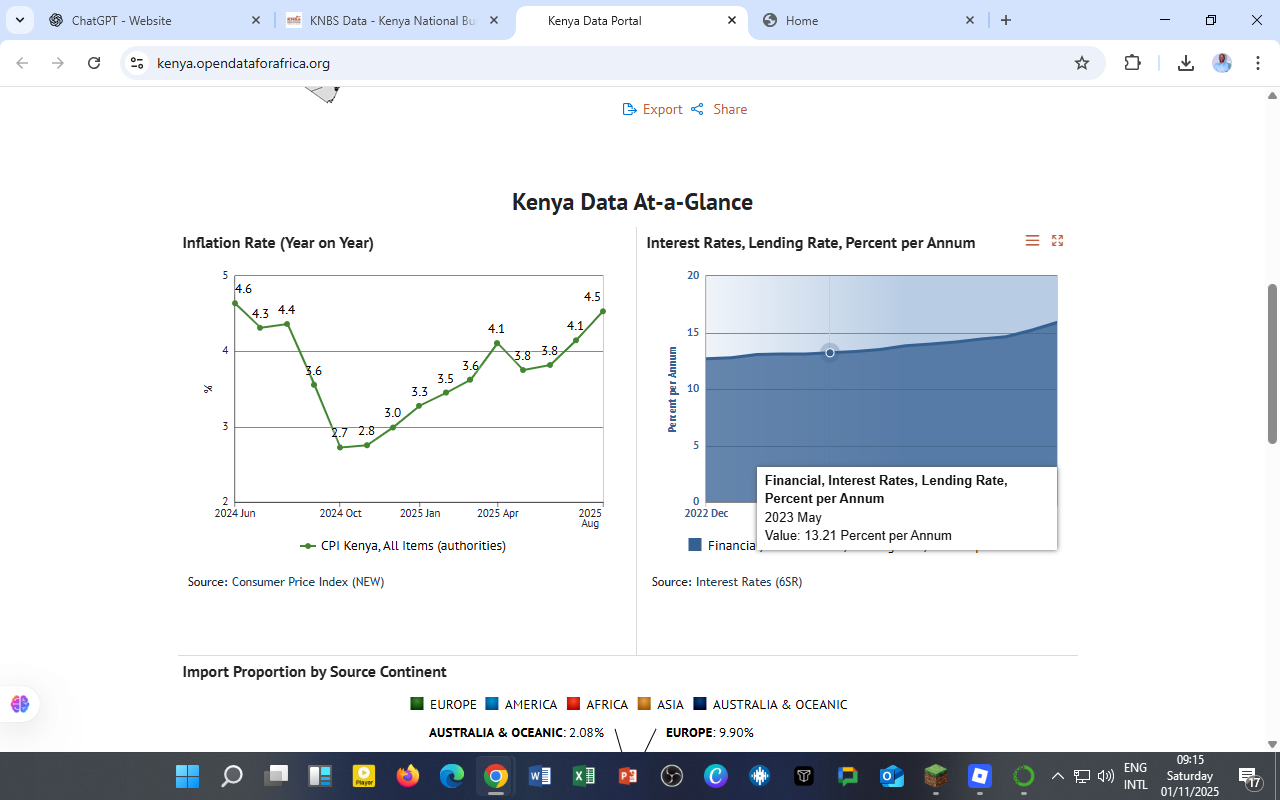
Kenya’s Economic Pulse 2025: Trade, Inflation, and Interest Rate Dynamics
By Collins Odhiambo OwinoAuthor | DatalytIQs AcademyData Source: Kenya National Bureau of Statistics (KNBS) – Kenya Data Portal Overview The Kenyan economy in 2025 reflects
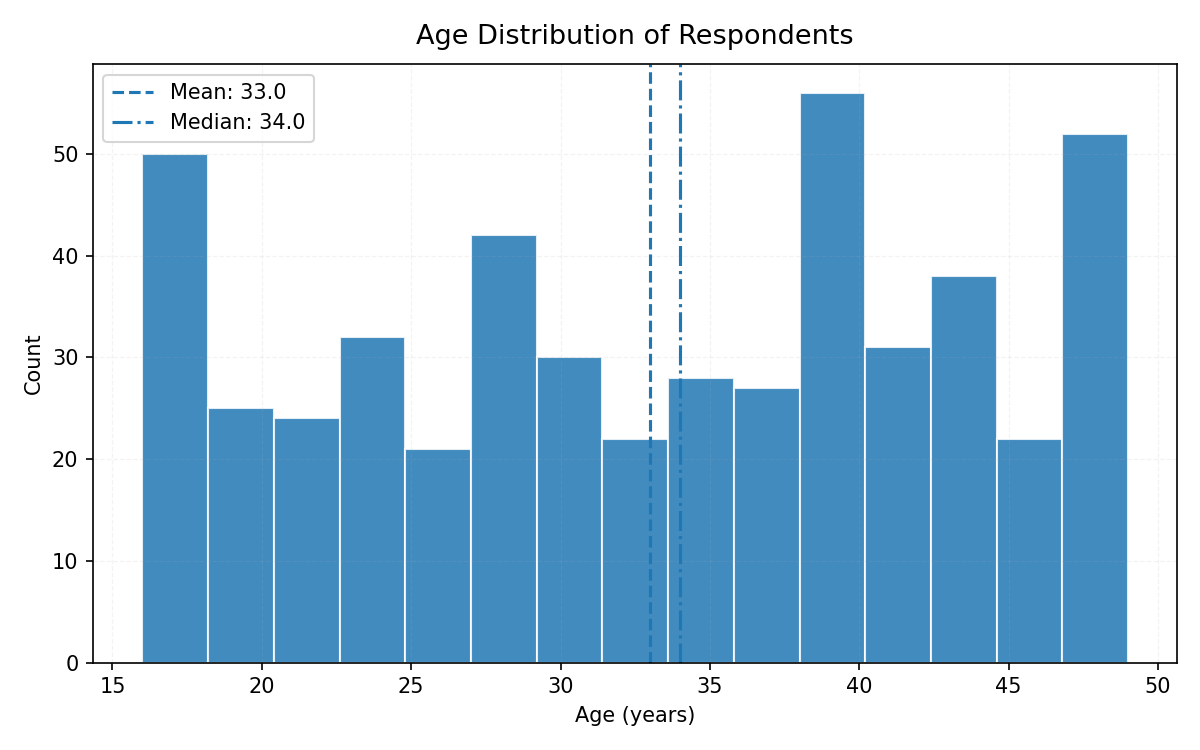
Understanding Digital Generations: What Age Tells Us About Online Habits
By Collins Odhiambo Owino — DatalytIQs AcademyData Source: Kaggle (Digital Wellbeing Dataset, 2025) Introduction In a data-driven world, age shapes how we connect, learn, and
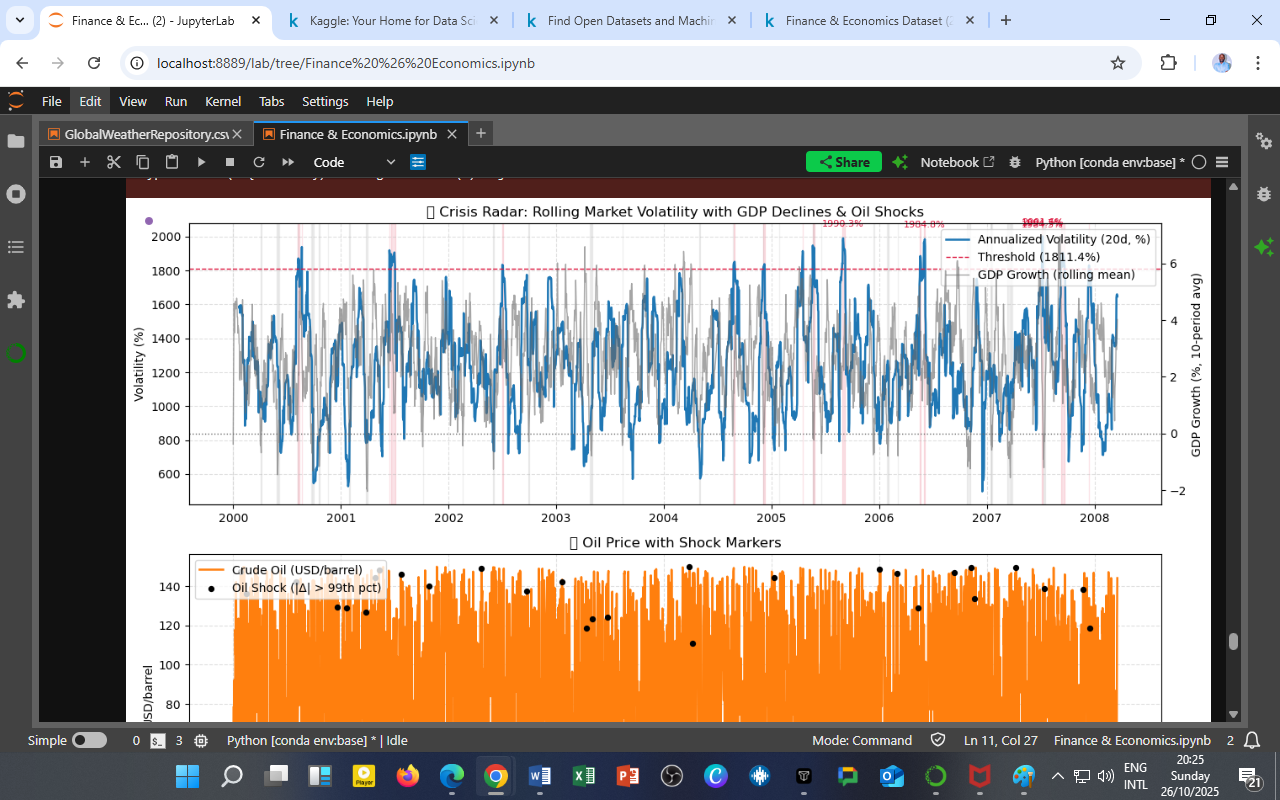
Crisis Radar: Rolling Market Volatility with GDP Declines & Oil Shocks
Source: Finance & Economics Dataset (2000–2025), computed in Python (pandas, NumPy, matplotlib). Overview This visualization integrates financial volatility, macroeconomic growth, and commodity market shocks into
Crisis Radar: Rolling Market Volatility with GDP Declines and Oil Shocks
Source: Finance & Economics Dataset (2000–2025), computed in Python using pandas, NumPy, and matplotlib. Overview This composite figure integrates financial volatility dynamics with macroeconomic downturns
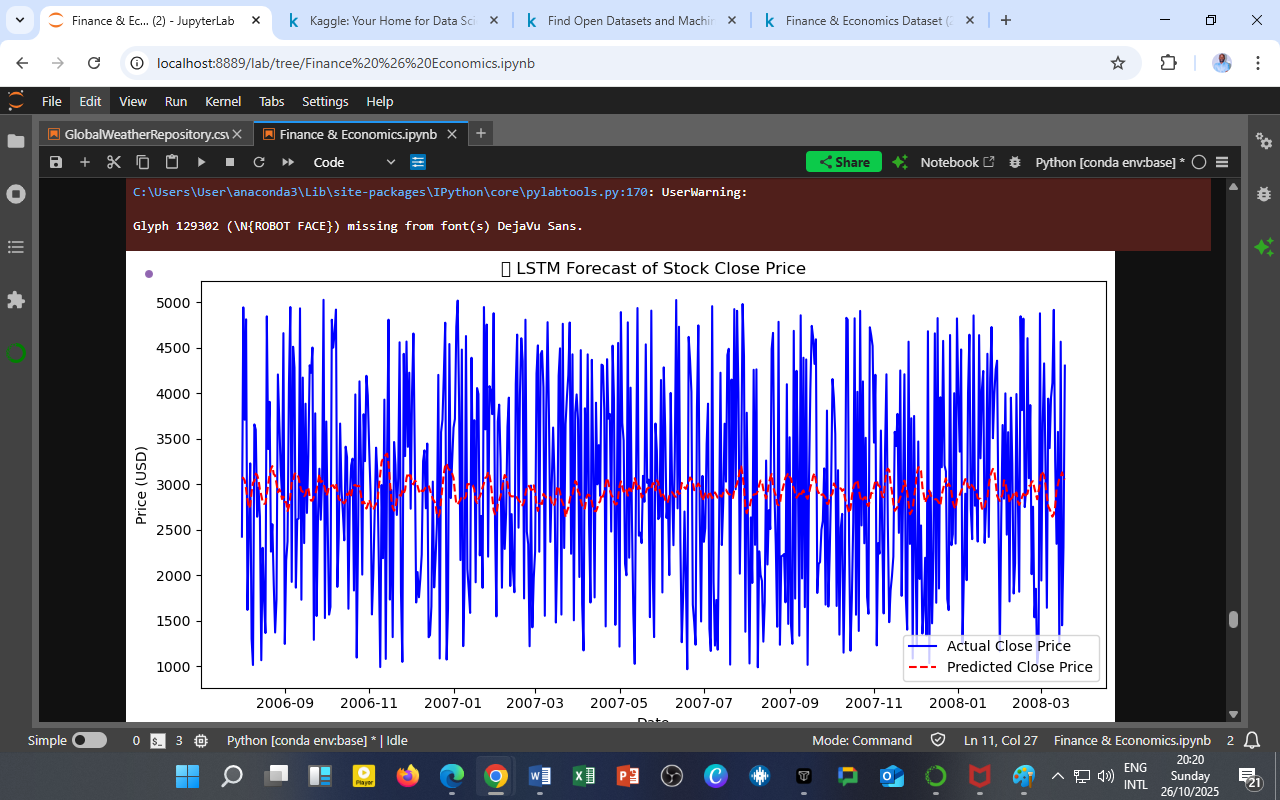
LSTM Forecast of Stock Close Price
Source: Finance & Economics Dataset (2000–2025), modeled using Python (TensorFlow/Keras). Model Overview The Long Short-Term Memory (LSTM) network was trained on daily stock closing prices
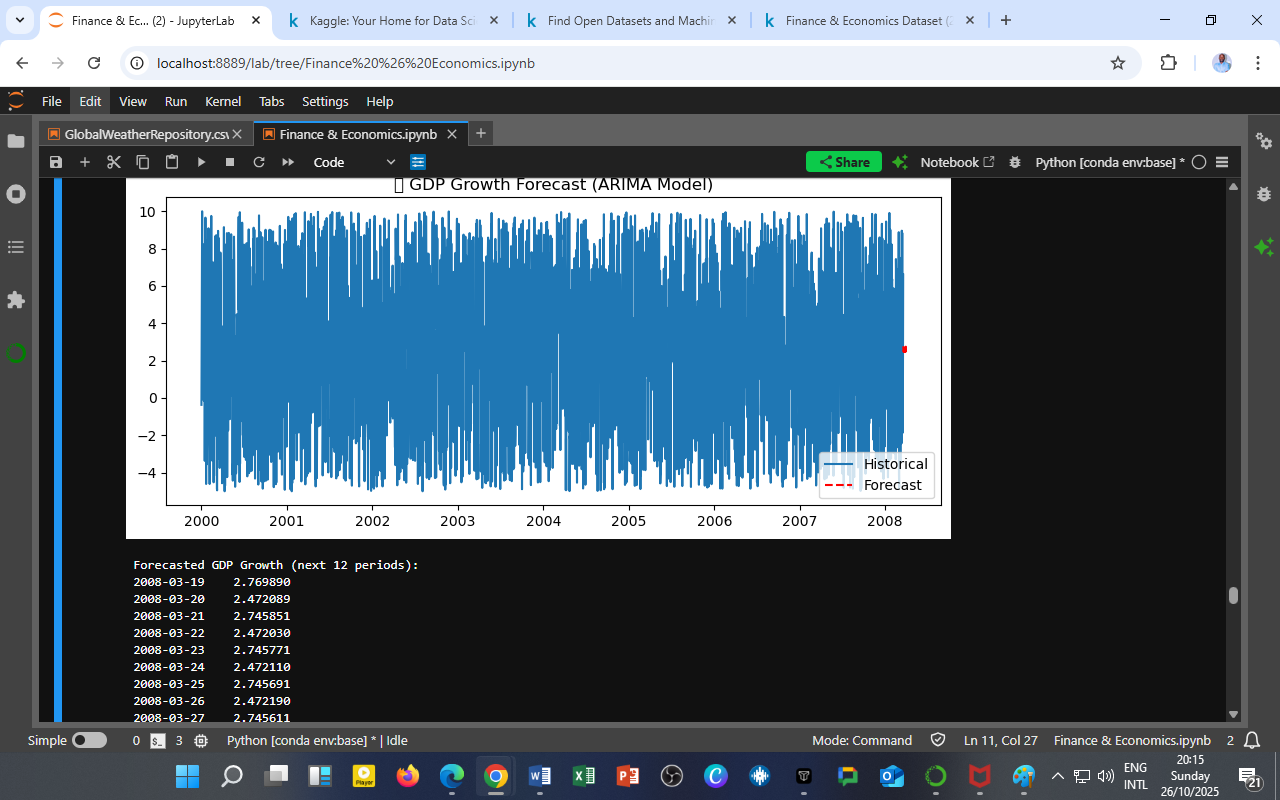
GDP Growth Forecast (ARIMA(2,1,2) Model)
Source: Finance & Economics Dataset (2000–2025), analyzed in Python using statsmodels SARIMAX forecasting. Interpretation This figure overlays the historical GDP growth series (2000–2008) with a
SARIMAX (ARIMA(2,1,2)) Model Results for GDP Growth (%)
Source: Finance & Economics Dataset (2000 – 2025), estimated in Python (statsmodels SARIMAX). | Parameter | Coefficient | Std. Error | z-Statistic | P >|
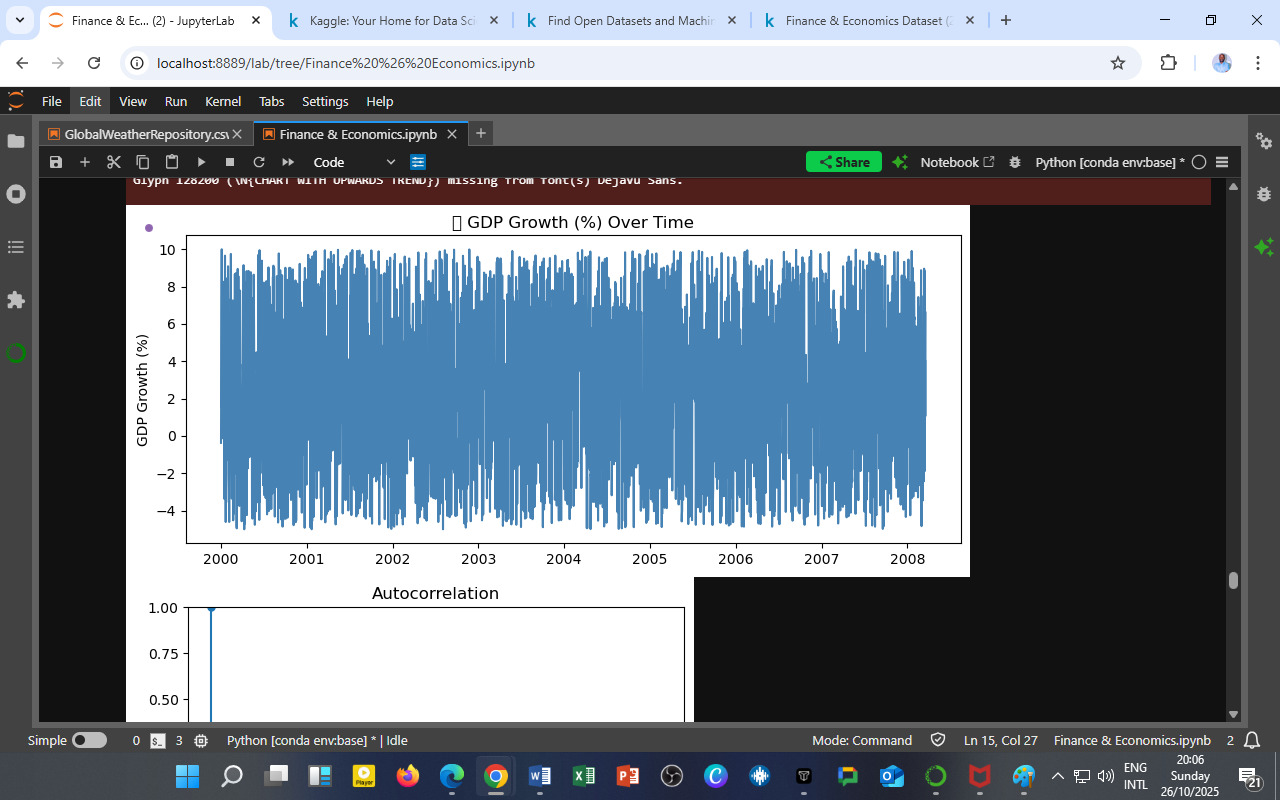
GDP Growth (%) Over Time
Source: Finance & Economics Dataset (2000–2025), processed using Python (pandas, matplotlib). Interpretation This time series chart shows daily GDP growth rate fluctuations over the period
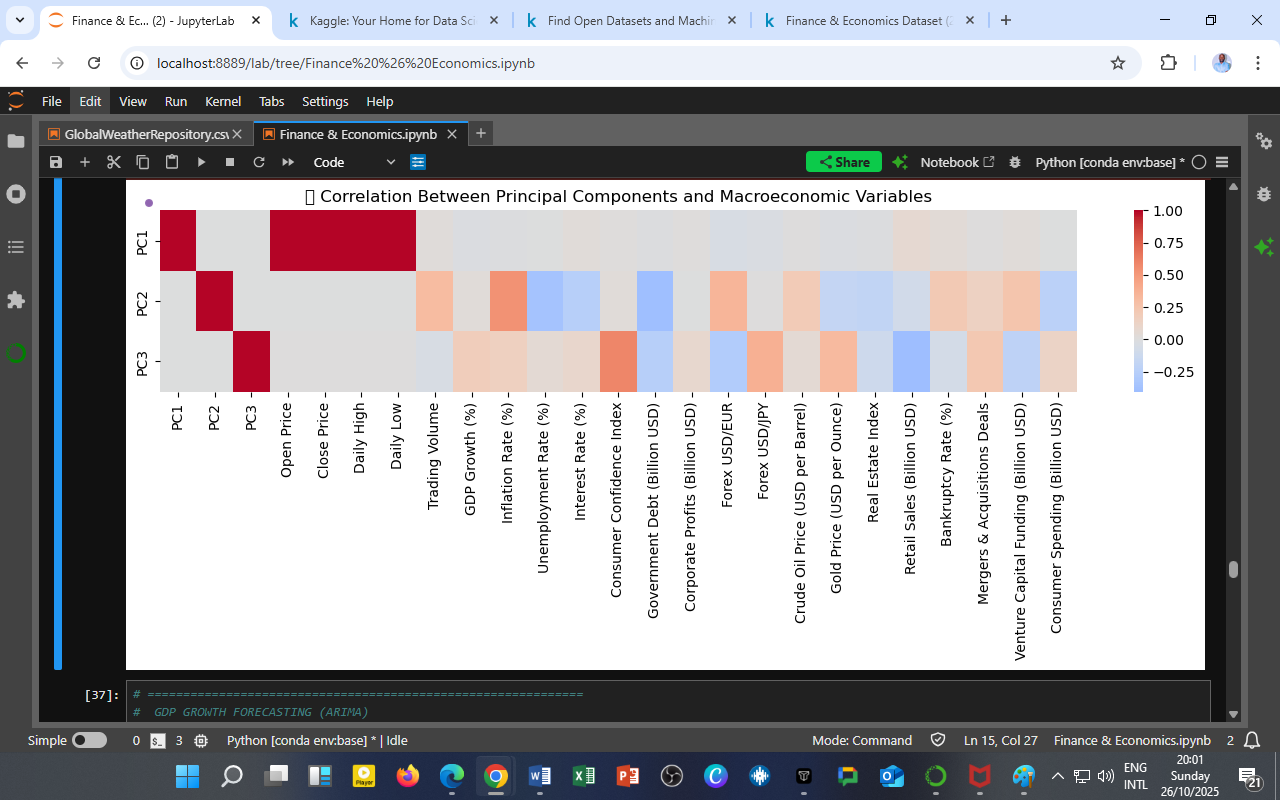
Correlation Between Principal Components and Macroeconomic Variables
Source: Finance & Economics Dataset (2000–2025), analyzed in Python (JupyterLab, seaborn heatmap visualization). Interpretation This heatmap shows how each Principal Component (PC1, PC2, PC3) correlates

You must be logged in to post a comment.