
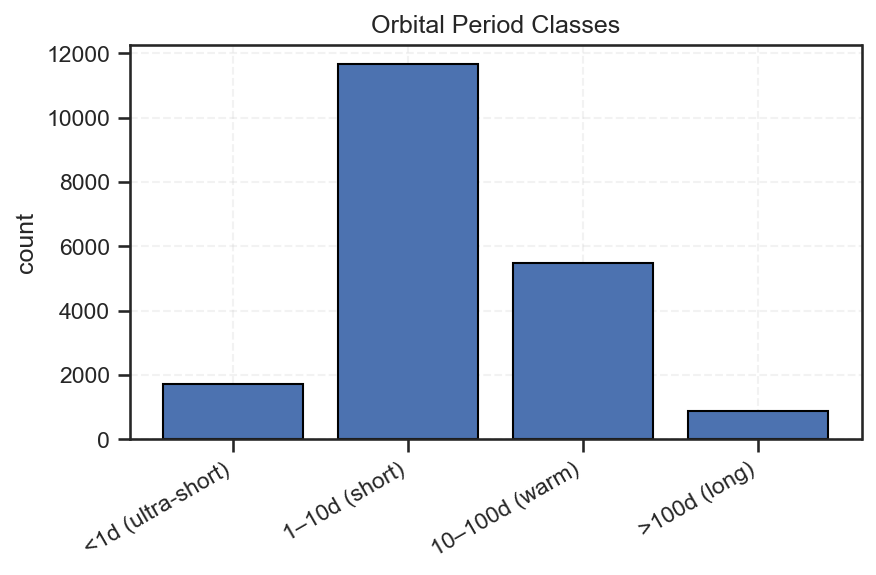
The Rhythm of Other Worlds: Understanding Kepler’s Orbital Period Classes
The Pulse of a Planetary System Every planet tells time — not with hours, but with orbits.The orbital period (how long a planet takes to
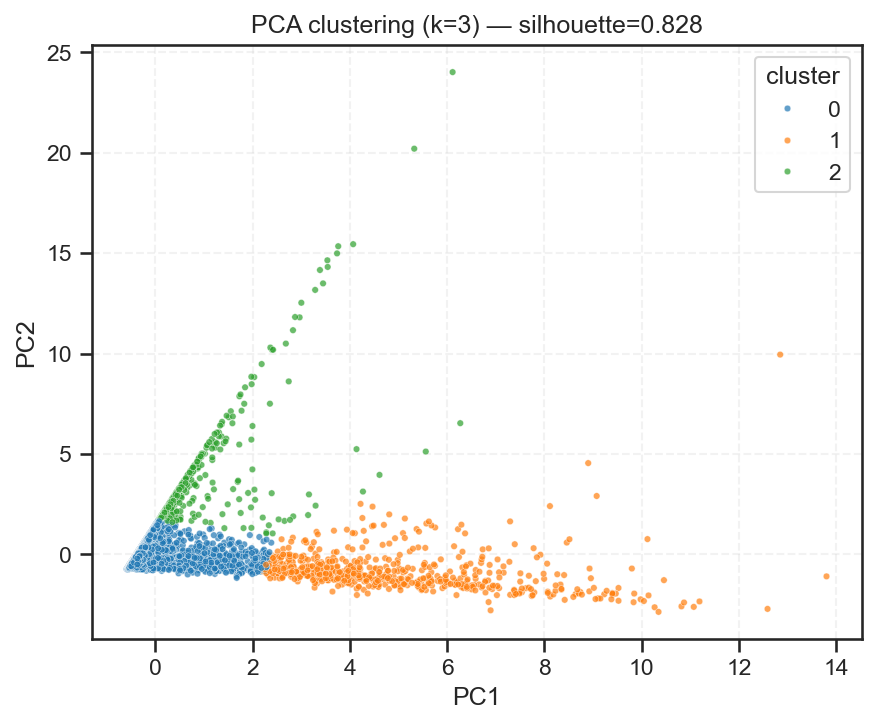
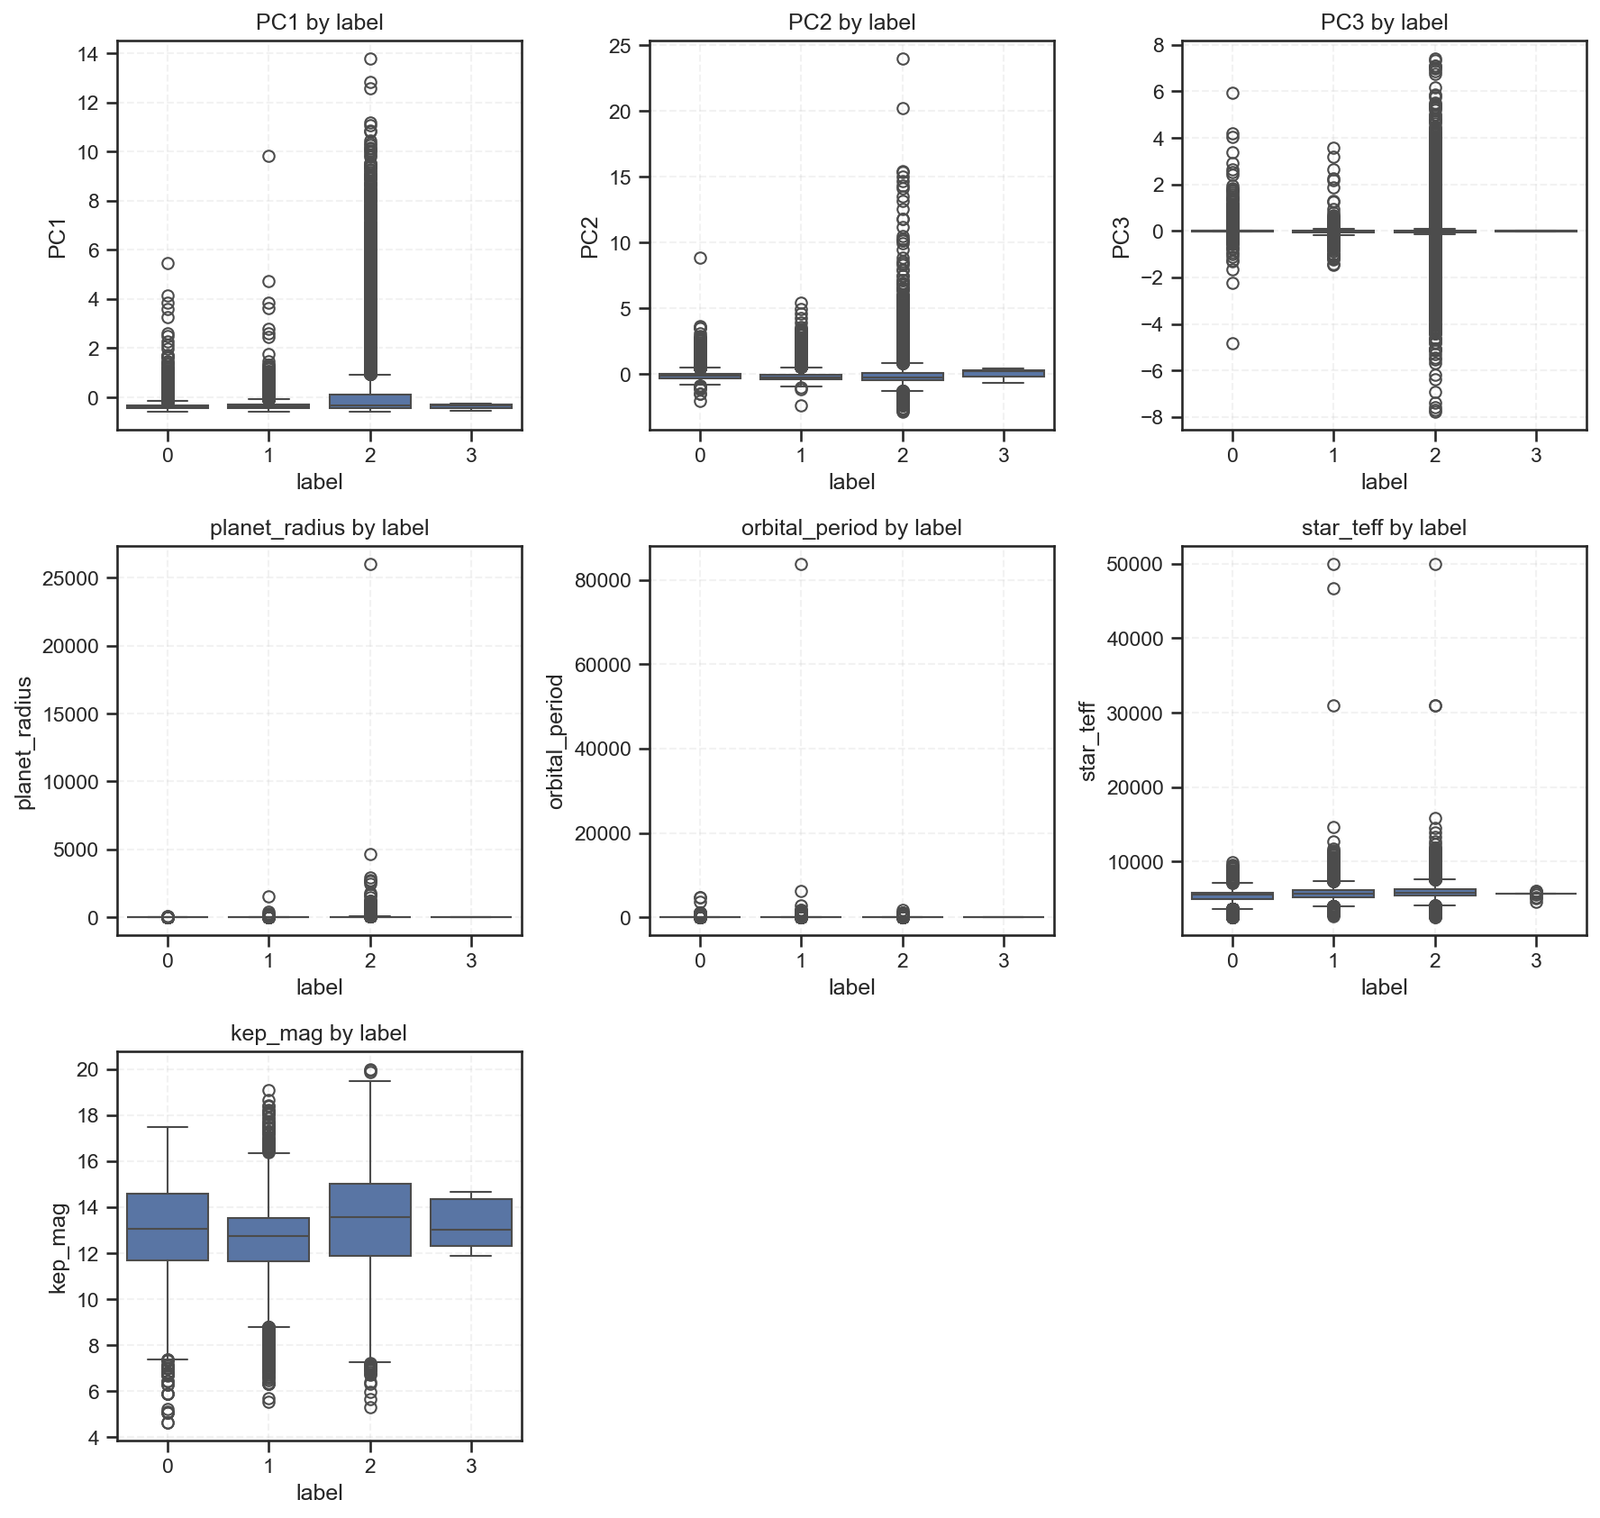
Clustering the Cosmos: Discovering Hidden Groups in the Kepler Exoplanet Data
From Features to Families of Worlds After mapping Kepler’s sky, analyzing distributions, and ranking feature importances, it’s time to ask a deeper question:Do exoplanets naturally
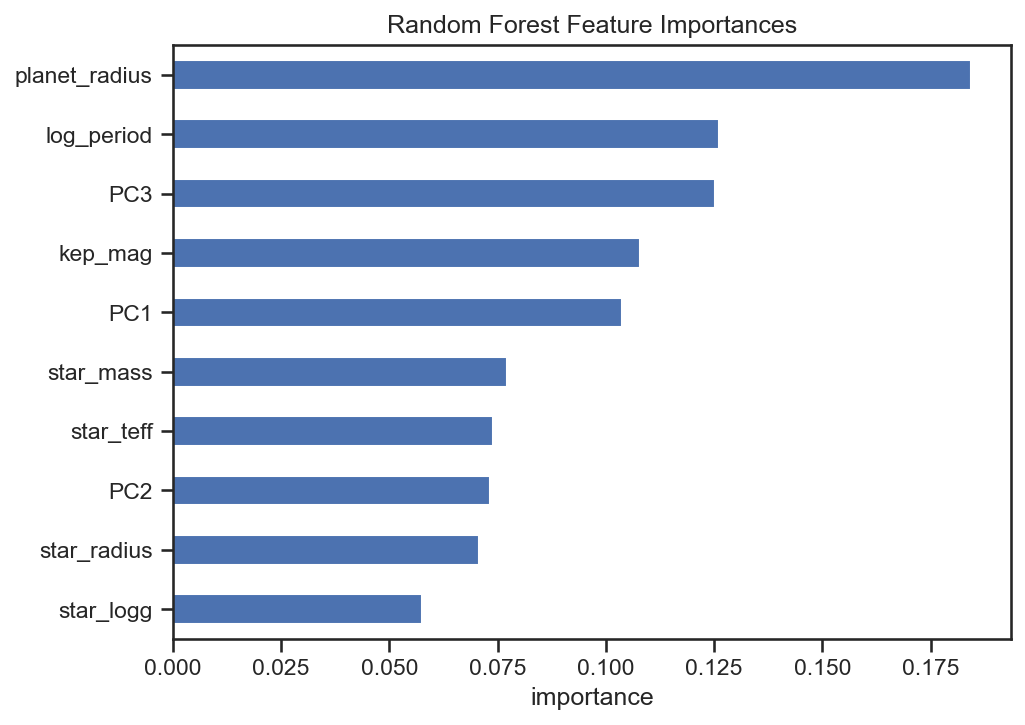
From Light to Logic: What Random Forests Reveal About Kepler’s Hidden Worlds
From Linear to Nonlinear Thinking After exploring feature distributions, class differences, and a logistic regression baseline, it was time to test how a more flexible
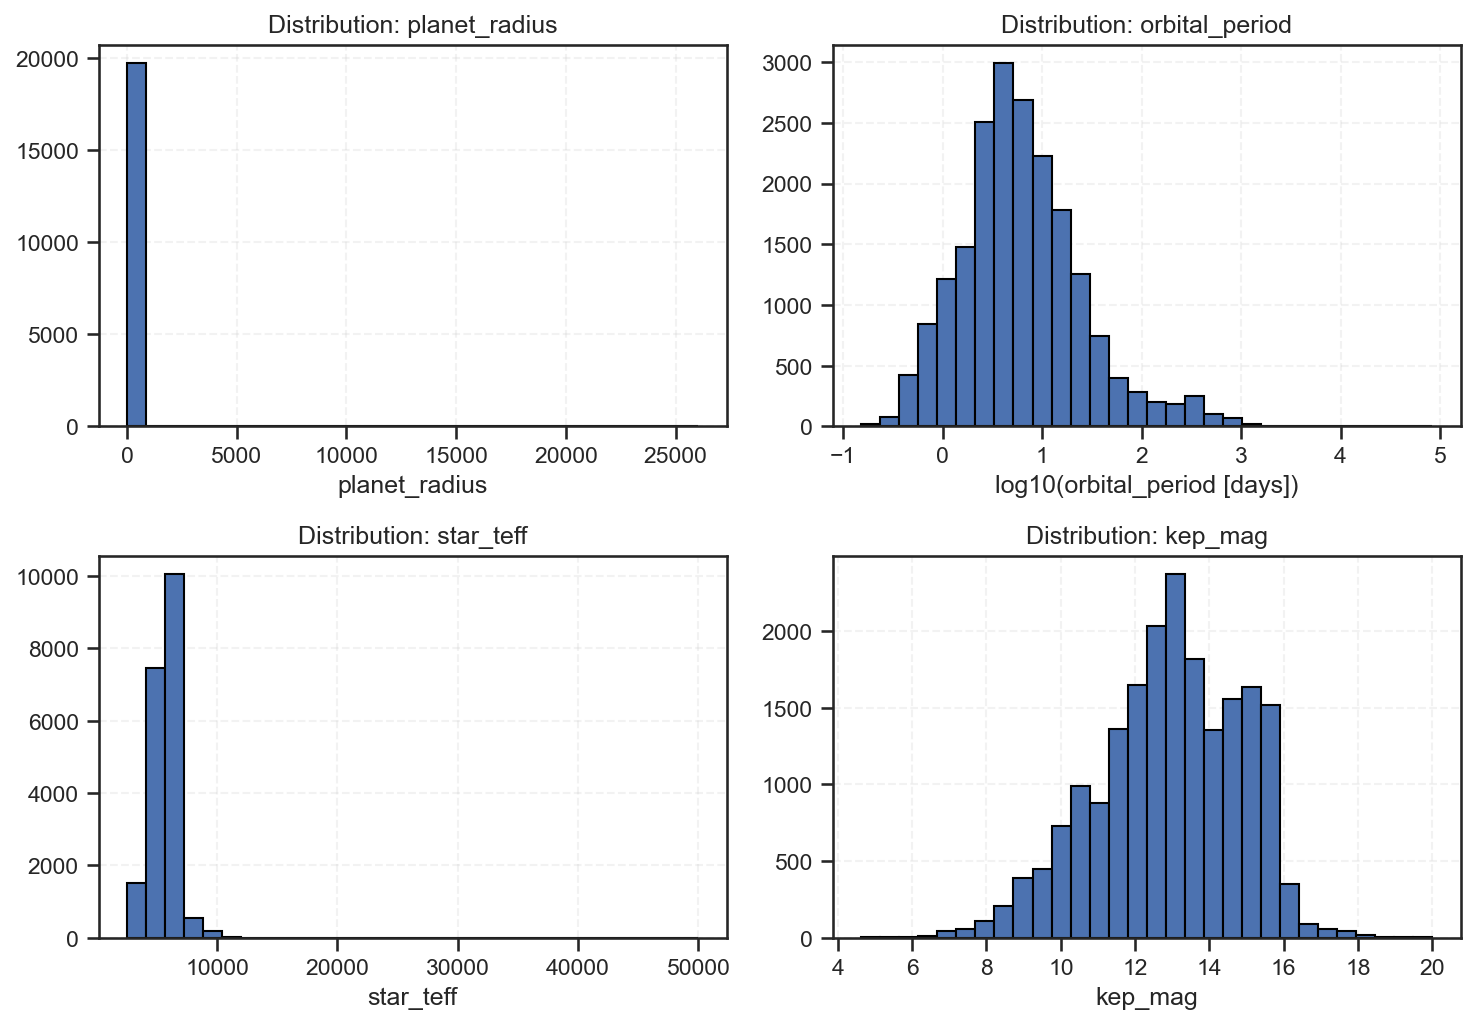
Decoding the Kepler Dataset: What the Numbers Tell Us Before the Model Does
The Story Before the Algorithm Before any model can predict, data must speak.The histograms below visualize how planetary and stellar features are distributed across the
Patterns Beneath the Stars: How Exoplanet Features Reveal Their Identity
Seeing the Universe Through Statistics In our previous post, we mapped the Kepler sky distribution and explored how logistic regression identifies exoplanet types using machine
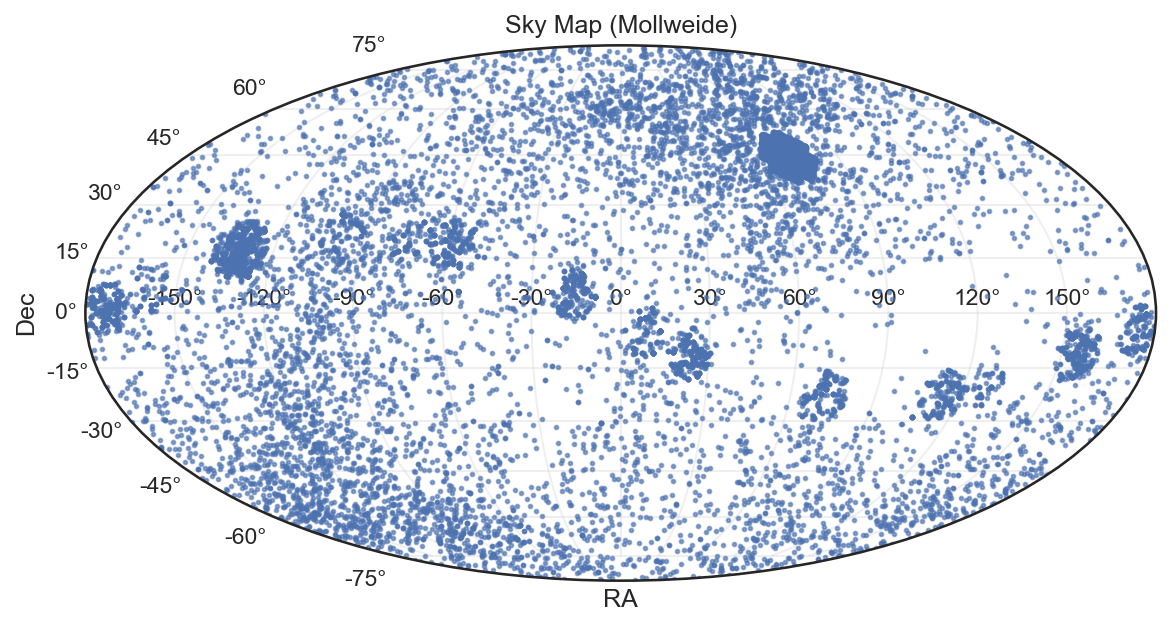
Sky Distribution of Kepler Objects
(Mollweide Projection — RA vs Dec) 1. Scientific Interpretation This map plots Right Ascension (RA) and Declination (Dec) for thousands of observed celestial bodies from
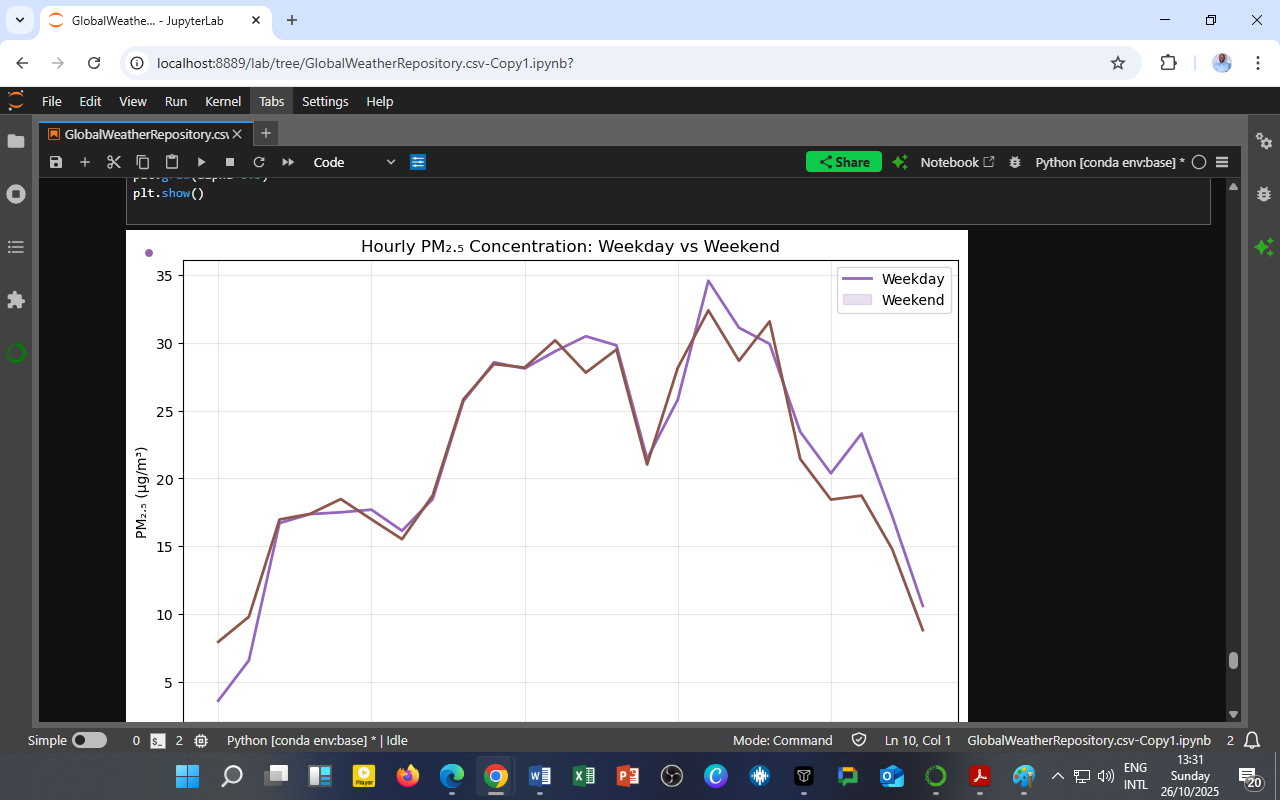
The Weekend Particulate Paradox: How PM₂.₅ Patterns Shift with Human Activity
By Collins Odhiambo | DatalytIQs Academy 1. Tiny Particles, Big Insights While gases like nitrogen dioxide (NO₂) and ozone (O₃) often take the spotlight in
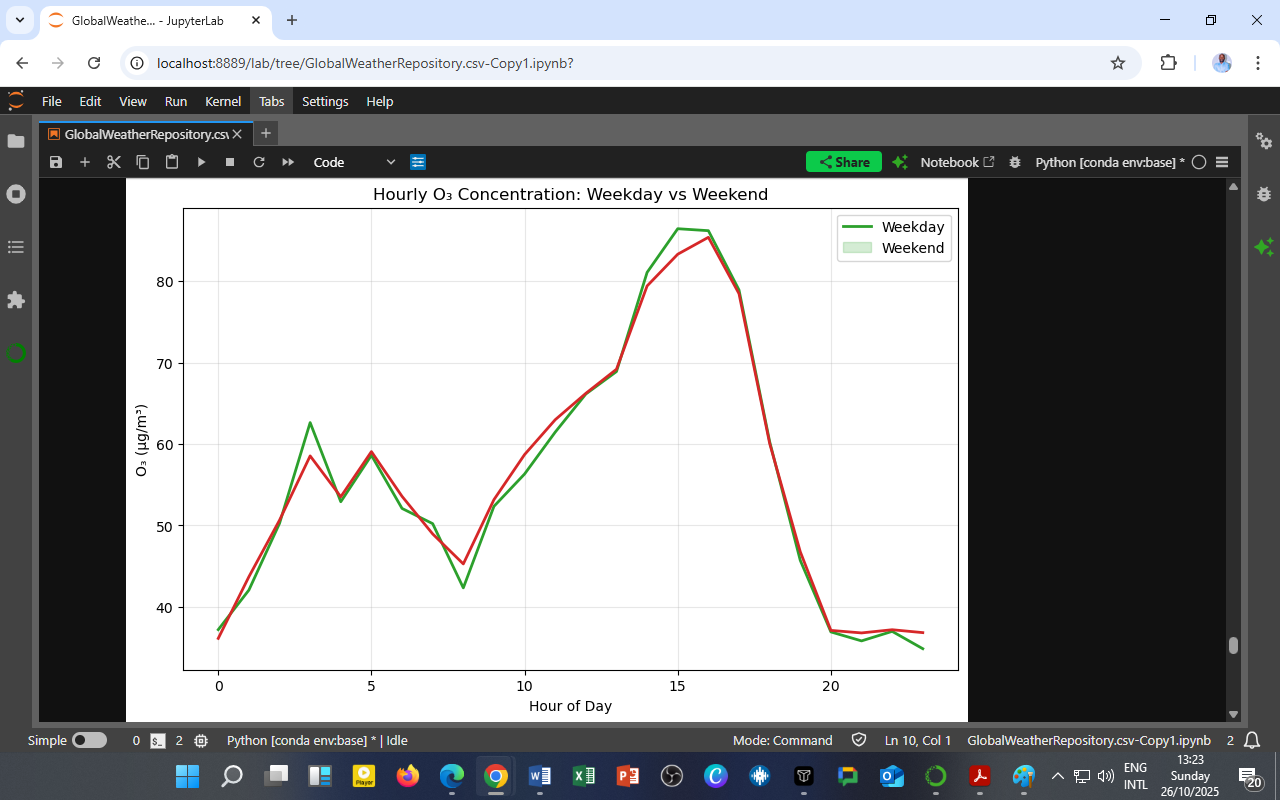
The Weekend Ozone Effect: Why Cleaner Air on Weekends Isn’t Always What It Seems
By Collins Odhiambo | DatalytIQs Academy 1. A Surprising Pattern in Urban Skies It seems intuitive that cleaner air should follow quieter weekends — fewer
Traffic, Time, and Air: Understanding NO₂ Variations Between Weekdays and Weekends
By Collins Odhiambo | DatalytIQs Academy 1. The Weekly Pulse of Urban Air Cities breathe differently on weekdays and weekends.When people commute, industries operate, and
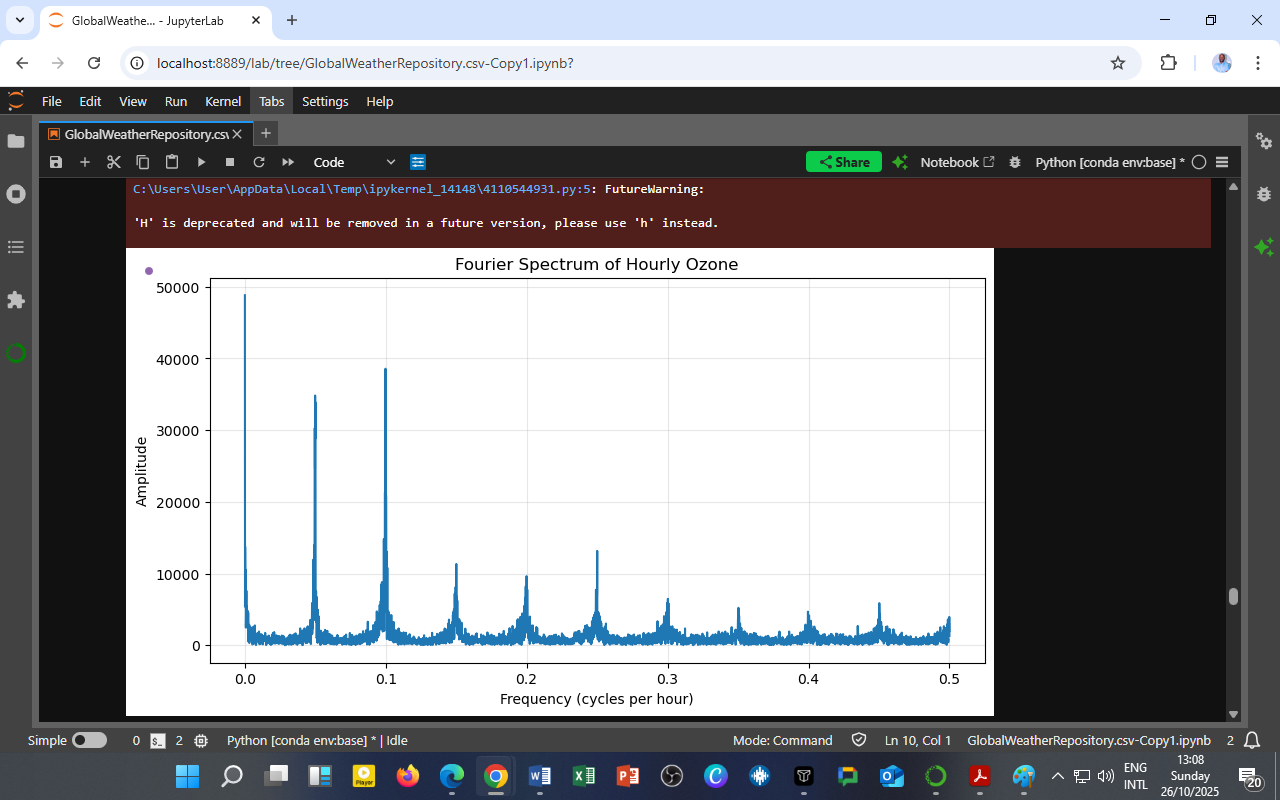
Revealing the Hidden Rhythms of Ozone: A Fourier Spectrum Analysis of Hourly Data
By Collins Odhiambo | DatalytIQs Academy 1. From Time to Frequency — Seeing Ozone’s Hidden Cycles Air quality data is often viewed as a line

You must be logged in to post a comment.