Context: Tariffs and the Price Channel
When governments impose tariffs, one of the key questions is: How much do import prices actually rise?
In theory, tariffs make imports costlier, but exchange-rate movements, supplier pricing, and corporate margins often absorb part of the shock.
The IMF’s analysis of US import prices excluding fuels compares two major tariff episodes:
-
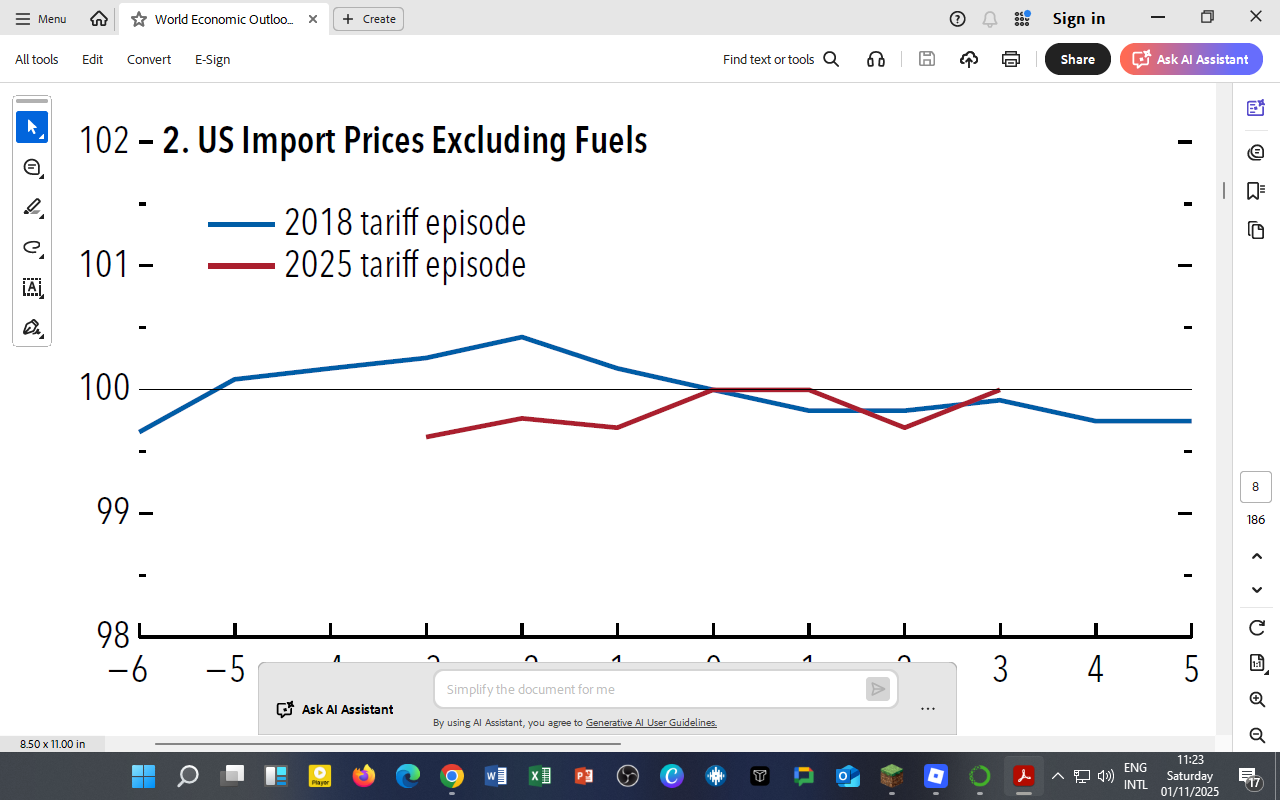
2018 episode (blue line): Tariffs during the US–China trade tensions.
-
2025 episode (red line): New trade restrictions and supply-chain restructuring under the 2025 global tariff wave.
Figure 1.8 (2) — US Import Prices (Excluding Fuels)

Observation:
-
Both episodes show limited movement in import prices (index near 100).
-
In 2018, prices rose slightly after tariffs were imposed, but fell back within a year.
-
In 2025, despite higher tariffs, import prices remained flat — reflecting stronger dollar appreciation and shifts toward alternative suppliers.
Tariffs in 2025 appear to have had smaller pass-through effects on import prices compared to 2018, suggesting firms have become more adept at diversifying supply chains and absorbing costs.
Why Prices Stayed Stable
| Stabilizing Factor | Description |
|---|---|
| Exchange Rate Buffer | A stronger US dollar offset import price increases. |
| Global Supply Diversification | Imports shifted from China to lower-cost Asian and Latin American producers. |
| Corporate Absorption | Retailers and manufacturers narrowed margins to protect demand. |
| Declining Freight Costs | Post-pandemic normalization of shipping rates reduced trade costs. |
Unlike 2018, global markets in 2025 are better positioned to absorb tariff shocks through structural flexibility rather than price inflation.
Implications for Global Trade and Emerging Economies
-
Reduced Pass-Through: Advanced economies are now less inflation-sensitive to tariff shocks.
-
Emerging Market Exposure: Developing economies like Kenya still feel indirect effects through imported goods (machinery, electronics).
-
Trade Re-routing: The redirection of US import demand creates new export opportunities for Asia, Africa, and Latin America.
Tariffs alone don’t always cause visible inflation — their impact depends on currency strength, trade substitution, and supply resilience.
Lessons for Kenya and Africa
-
Kenya can capitalize on supply-chain diversification by positioning itself as a value-added exporter within the AfCFTA framework.
-
Building regional manufacturing clusters in electronics, textiles, and logistics could attract trade re-routing from Asia.
-
Maintaining exchange-rate stability remains essential to shield against imported inflation.
For DatalytIQs Academy Learners
Recreate this analysis by:
-
Using Matplotlib to plot 2018 vs 2025 tariff episode indices.
-
Simulating the effect of a 5 % tariff increase on Kenya’s imported goods using exchange-rate elasticities.
-
Calculating pass-through coefficients to estimate how much global price shocks translate into domestic inflation.
Data and Acknowledgment
Source: IMF World Economic Outlook (October 2025) – Figure 1.8 (2) “US Import Prices Excluding Fuels.”
Acknowledgment: IMF staff calculations using Bureau of Labor Statistics (BLS) import price indices.
Author: Collins Odhiambo Owino, DatalytIQs Academy
Leave a Reply
You must be logged in to post a comment.