Grades are not just outcomes; they are indicators of understanding, effort, and consistency.
At DatalytIQs Academy, we analyze learning data to identify what shapes academic results. Using the Kaggle student_exam_scores.csv dataset, this post examines how exam scores are distributed among students and what the shape of that distribution reveals about classroom learning dynamics.
Understanding the Histogram

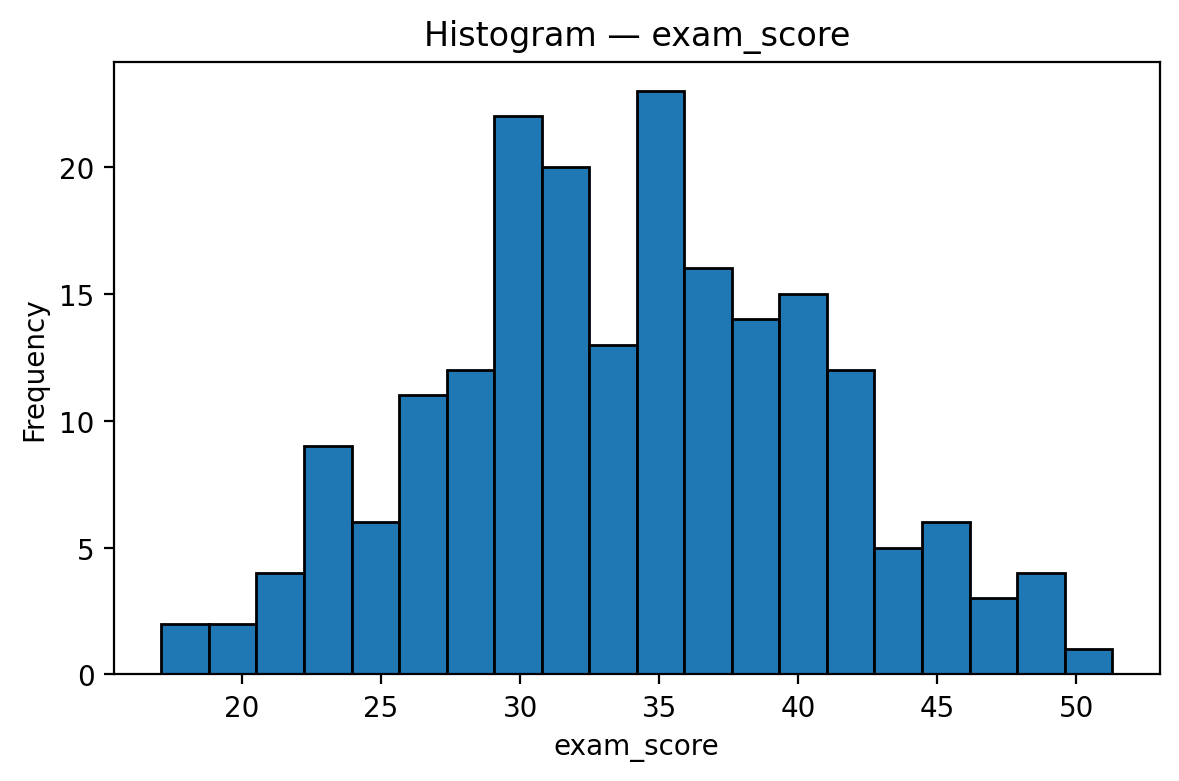
The histogram represents the distribution of student exam scores ranging from about 18 to 50 marks.
The curve shows a near-normal pattern, with most students clustered around 30–36 marks, suggesting that the majority are performing at an average level while fewer students occupy the lower and upper extremes.
Interpretation
-
Central Tendency:
The peak frequency appears near 33 marks; this is where most students’ scores fall. It represents a balance point between lower and higher achievers. -
Symmetry and Spread:
The histogram is fairly symmetric, indicating that performance levels are evenly distributed on both sides of the mean. -
Upper and Lower Extremes:
A small group scores above 45 (high achievers), while another group falls below 25 (students needing academic support).
Educational Insights
| Observation | Interpretation | Recommended Action |
|---|---|---|
| Scores cluster around 30–36 | Consistent average performance | Continue the current curriculum, but enrich learning resources |
| Few high achievers (≥45) | Exceptional comprehension | Introduce peer-tutoring or advanced modules |
| Few low performers (≤25) | Learning gaps present | Implement targeted remedial support and mentorship |
Strategic Implications
A near-normal distribution of exam scores reflects a well-balanced teaching approach where most learners benefit from classroom instruction.
However, the presence of tails on both sides underscores the need for differentiated learning interventions:
-
Low performers may benefit from more guided practice and individualized attention.
-
Top performers should be provided with enrichment programs that sustain motivation and prevent stagnation.
Such insights help educators and institutions design data-driven learning improvement strategies, the kind that elevate entire cohorts rather than individual successes alone.
Acknowledgment
Data Source: Kaggle — student_exam_scores.csv
Analysis and Visualization: Education Analytics Unit, DatalytIQs Academy (2025)
Leave a Reply
You must be logged in to post a comment.