By Collins Odhiambo | DatalytIQs Academy
1. A Surprising Pattern in Urban Skies
It seems intuitive that cleaner air should follow quieter weekends — fewer cars, less industry, lower pollution.
Yet, atmospheric chemistry often defies simplicity.
This analysis from DatalytIQs Academy’s Environmental Analytics Lab compares hourly ozone (O₃) concentrations between weekdays and weekends, revealing a curious reversal: while nitrogen dioxide (NO₂) tends to drop on weekends, ozone often rises.
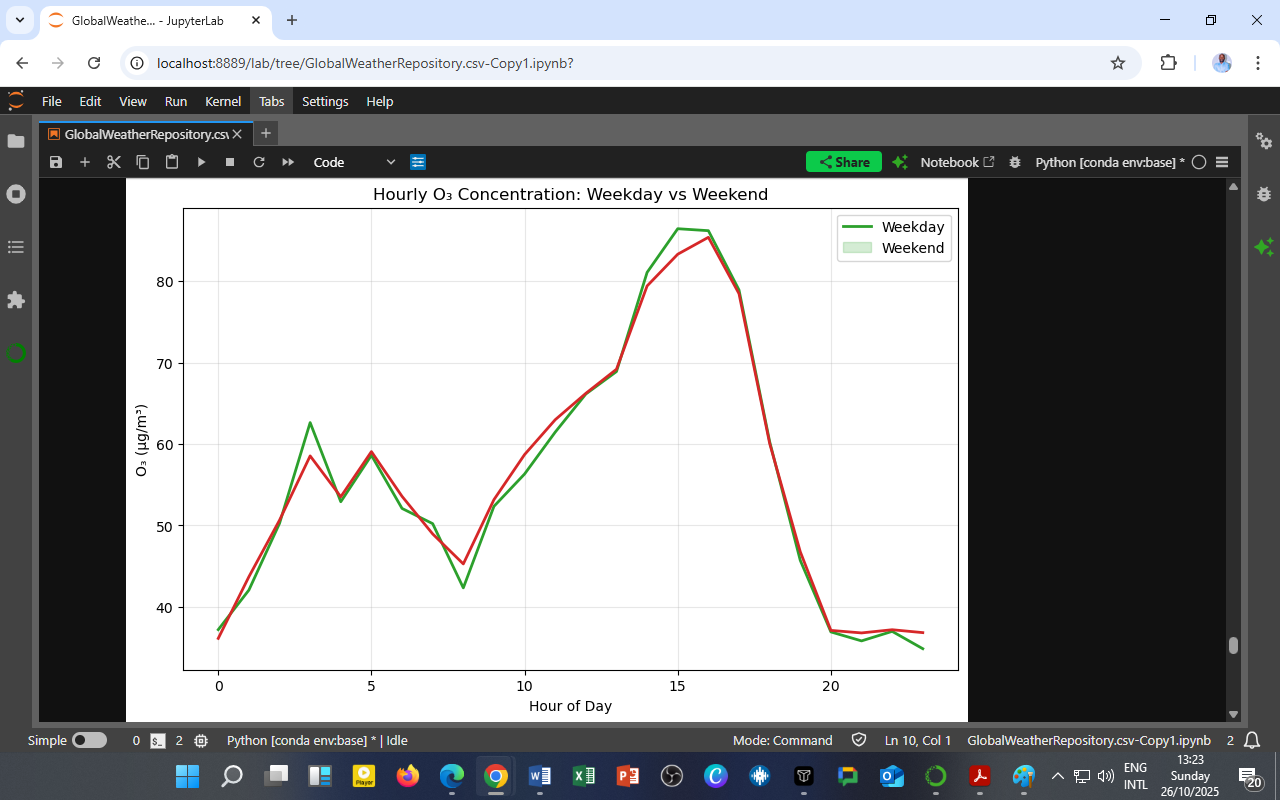
📊 Chart Title: Hourly O₃ Concentration: Weekday vs Weekend
🟩 Weekday — green line
🟥 Weekend — red line

2. Understanding the Chart
The figure shows hourly mean ozone concentrations (µg/m³) across a 24-hour cycle.
Key Observations:
-
Morning (00:00–06:00): O₃ remains low (~35–45 µg/m³) during night hours when photolysis halts.
-
Late morning (07:00–10:00): Levels begin to rise sharply as sunlight initiates photochemical reactions.
-
Afternoon (13:00–17:00): Ozone peaks at ~85 µg/m³, coinciding with maximum solar radiation and atmospheric mixing.
-
Evening (18:00–22:00): O₃ rapidly declines as sunlight fades and titration by NO resumes.
Both weekday and weekend curves show the same diurnal rhythm — but weekends tend to have slightly higher ozone levels, especially in the afternoon.
This is the hallmark of the “Weekend Ozone Effect.”
3. The Science: Why Ozone Increases When NO₂ Decreases
The paradox arises from nonlinear photochemistry involving nitrogen oxides (NOₓ = NO + NO₂) and volatile organic compounds (VOCs):
During weekdays:
-
Heavy traffic emits high NO, which reacts with O₃ to form NO₂:
-
This titration suppresses ozone near the ground.
On weekends:
-
Fewer vehicles → less NO emission → less O₃ destruction.
-
Remaining NO₂ and VOCs under sunlight continue forming new O₃.
Result: Lower NOₓ but higher O₃ — an ironic by-product of “cleaner” weekends.
4. Quantitative Comparison
| Period | Weekday O₃ (µg/m³) | Weekend O₃ (µg/m³) | Key Process |
|---|---|---|---|
| Night (0–6h) | 38–45 | 37–43 | Stable, low mixing, O₃ consumed by NO |
| Morning (7–10h) | 45–60 | 48–63 | Onset of photochemistry |
| Afternoon (13–17h) | 80–85 | 83–88 | Maximum O₃ production |
| Evening (18–22h) | 35–40 | 36–42 | Rapid decay as sunlight fades |
The weekend enhancement averages 3–5 µg/m³ higher in mid-afternoon, signifying a measurable photochemical compensation effect.
5. Environmental and Policy Implications
1. Rethinking Emission Controls
O₃ formation is nonlinear — simply reducing NOₓ emissions may not immediately lower ozone, especially in VOC-limited regimes.
Balanced emission policies must target both NOₓ and VOC sources (e.g., solvents, fuels, biomass burning).
2. Air-Quality Forecasting
Hourly and day-type analyses improve predictive modeling.
Forecast systems can anticipate higher weekend ozone despite overall lower traffic.
3. Health Considerations
High afternoon O₃ poses respiratory and cardiovascular risks, even when other pollutants drop.
Public advisories should emphasize avoiding intense outdoor exercise between 1–4 PM on sunny days.
4. SDG Integration
| SDG | Focus | Policy Link |
|---|---|---|
| SDG 3 – Good Health | Reduce O₃-related illness | Public advisories and alert systems |
| SDG 11 – Sustainable Cities | Smart emission management | Integrate traffic and VOC control |
| SDG 13 – Climate Action | Link O₃ cycles to solar and temperature trends | Data-driven adaptation planning |
6. Educational Insight for DatalytIQs Academy Learners
This visualization illustrates photochemical feedback — how reducing one pollutant (NO₂) can inadvertently raise another (O₃).
At DatalytIQs Academy, learners replicate such analyses using Python:
Students explore how atmospheric chemistry, meteorology, and human activity combine to produce complex air-quality patterns.
7. Conclusion: The Double-Edged Sword of Cleaner Air
The Weekend Ozone Effect reveals a critical truth:
Reducing emissions is essential — but how and what we reduce matters even more.
Cleaner weekends show that atmospheric chemistry can rebound in unexpected ways, teaching us that true air-quality improvement requires systems thinking — integrating science, data, and policy into one cohesive strategy.
Data Source
Dataset: GlobalWeatherRepository.csv
Variables Analyzed: Hourly O₃ (µg/m³), Hour of Day, Day Type (Weekday/Weekend)
Period Covered: 2024–2025
Source: DatalytIQs Academy – Global Weather and Air Quality Repository
Processing Tools: Python (pandas, seaborn, matplotlib) in JupyterLab
Analysis Location: DatalytIQs Environmental Analytics Lab, Kisumu, Kenya
Author
Written by Collins Odhiambo
Data Analyst & Educator
DatalytIQs Academy – Where Data Meets Discovery.
Leave a Reply
You must be logged in to post a comment.