The Daily Dance of Ozone and Nitrogen Dioxide: What the Diurnal Cycle Reveals About Urban Air Quality
By Collins Odhiambo | DatalytIQs Academy
1. Introduction: A 24-Hour Story in the Sky
Every city breathes — not with lungs, but through its atmosphere.
As dawn breaks and traffic hums to life, invisible reactions begin in the air. Two key actors, Ozone (O₃) and Nitrogen Dioxide (NO₂), rise and fall through the day in a delicate rhythm scientists call the diurnal cycle.
Understanding this cycle is more than academic — it’s a blueprint for healthier cities, smarter policies, and cleaner futures.
2. The Science Behind the Graph
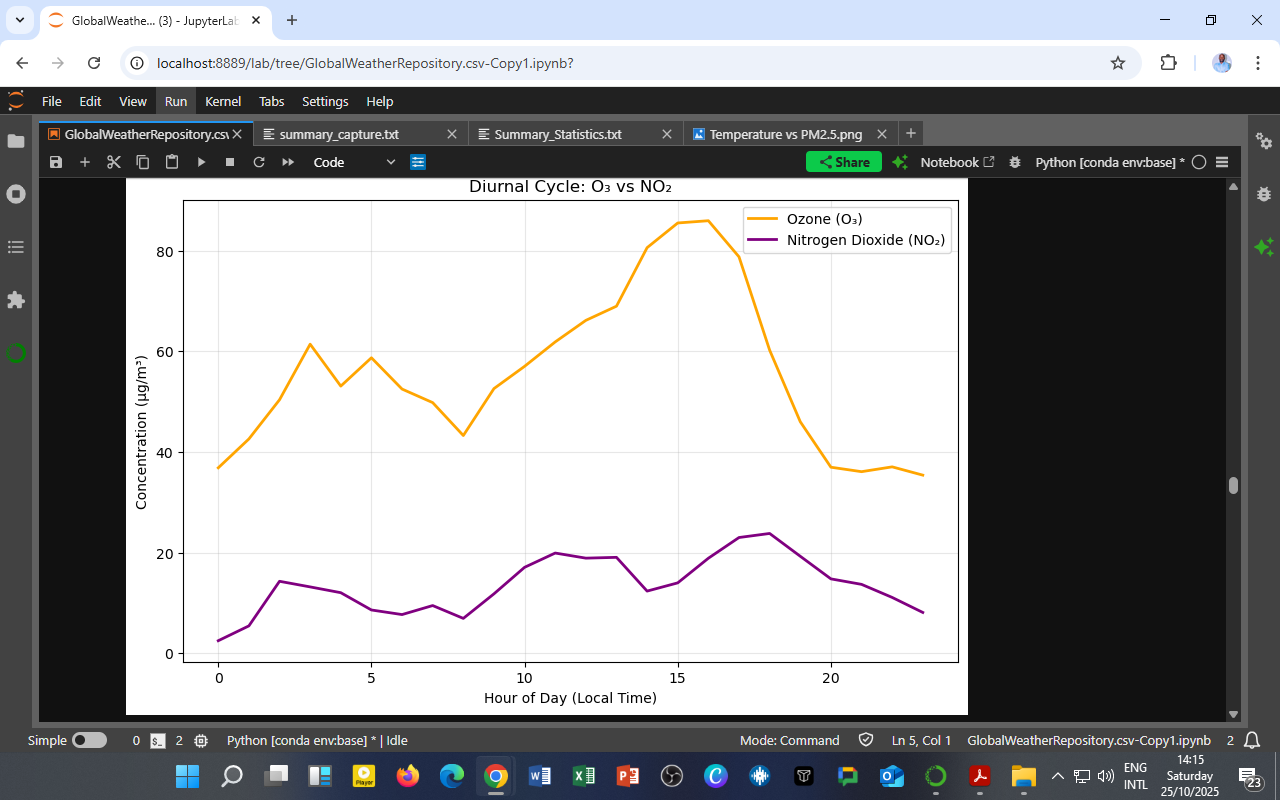
A typical diurnal plot shows hourly mean concentrations of:
-
Ozone (O₃) — the secondary pollutant formed in sunlight, and
-
Nitrogen Dioxide (NO₂) — the primary pollutant released from combustion and traffic.
The horizontal axis spans hours (0–23), while the vertical axis shows concentration (µg/m³).
What emerges is a striking mirror-image pattern between the two gases.
3. O₃: The Midday Climber
Rising with the Sun:
After sunrise, ozone levels rise rapidly, peaking around 14:00–16:00, when sunlight is at its strongest.
This occurs due to photochemical reactions:
As ultraviolet light breaks down NO₂, atomic oxygen (O) combines with molecular oxygen (O₂) to form ozone.
After Sunset:
When sunlight fades, this reaction comes to a halt. O₃ is consumed through titration with nitric oxide:
Ozone thrives on sunshine and disappears with darkness — a perfect reflection of its photochemical nature. Ozone levels drop sharply overnight.
4. NO₂: The Rush-Hour Pollutant
Morning and Evening Peaks:
NO₂ shows a bimodal pattern:
-
Morning peak (07:00–09:00): Rush-hour traffic and industrial start-ups.
-
Evening rise (17:00–20:00): Second wave of vehicle emissions.
Midday Dip:
Between 10:00–15:00, sunlight drives photolysis, converting NO₂ to O₃ — hence NO₂ levels drop.
NO₂ is a direct indicator of anthropogenic activity, especially transport emissions. Its cycle captures how human behavior shapes urban air chemistry.
5. The O₃–NO₂ Relationship: Perfectly Out of Sync
When ozone rises, nitrogen dioxide falls — and vice versa.
This inverse relationship defines photochemical smog formation: NO₂ both creates and limits ozone.
Morning: primary pollution (NO₂) dominates.
Afternoon: secondary pollution (O₃) takes over.
This interplay underpins modern urban air-quality dynamics.
6. What the Cycle Means for You
| Time of Day | Dominant Pollutant | Key Source | Health Implication |
|---|---|---|---|
| 06:00–09:00 | NO₂ | Traffic & combustion | Respiratory irritation for commuters |
| 12:00–16:00 | O₃ | Photochemical reactions | Oxidative stress & reduced lung function |
| 21:00–05:00 | NO₂ & PM | Trapped pollutants | Poor dispersion & nocturnal exposure |
Environmental insight:
Urban residents are exposed to different air-quality risks depending on the hour — a crucial detail often hidden in daily averages.
7. From Data to Policy: Why This Matters
Target Emissions When They Matter Most
-
Restrict heavy-polluting traffic during 07:00–09:00 and 17:00–20:00.
-
Encourage “Clean Air Hours” during these peaks.
-
Real-Time Air Quality Alerts
Use hourly trends to issue smart notifications — e.g., “Avoid outdoor exercise between 1–4 PM due to high ozone levels.”
This promotes SDG 3 – Good Health and Well-Being.
Sustainable Transport Reform
NO₂ peaks justify stronger investment in:
-
Public transport,
-
Electric mobility, and
-
Car-free zones during rush hours.
Rethinking Air-Quality Standards
Hourly variations prove that daily averages mask real risk.
Regulators should adopt hour-by-hour exposure standards to protect citizens.
Smarter Energy & Industrial Scheduling
Industries can adjust operations to minimize simultaneous pollutant peaks, reducing cumulative smog formation.
Studying the “Weekend Effect”
Comparing weekday vs. weekend cycles helps test temporary emission bans or alternate-day driving schemes.
Integrating with Climate and Urban Design
The diurnal cycle data aid in:
-
Urban ventilation planning,
-
Green belt zoning, and
-
Heat-island mitigation — all vital for SDG 11 (Sustainable Cities) and SDG 13 (Climate Action).
8. Policy Matrix: Linking Science to Action
| SDG | Focus Area | Diurnal Policy Application |
|---|---|---|
| SDG 3 | Good Health & Well-Being | Timed air-quality alerts to reduce exposure |
| SDG 11 | Sustainable Cities | Transport & urban design aligned with emission cycles |
| SDG 13 | Climate Action | Integrating air-quality data in adaptation plans |
9. The Bigger Picture: Science for Smarter Governance
Understanding the O₃–NO₂ rhythm enables:
-
Evidence-based decision-making,
-
Cross-sector coordination (environment, health, transport, energy), and
-
International compliance with the WHO and Paris Climate standards.
This is not just atmospheric chemistry — it’s data-driven governance.
Conclusion: The Pulse of Urban Air
The diurnal cycle of O₃ and NO₂ captures the heartbeat of city life — pulsing with sunlight, traffic, and temperature.
By aligning policies with these natural rhythms, cities can breathe cleaner, live longer, and plan smarter.
Author
Written by Collins Odhiambo
Educator, Data Analyst
DatalytIQs Academy – Where Data Meets Discovery.
Leave a Reply
You must be logged in to post a comment.