Temperature and Air Pollution: The Seasonal Tug of War Between Heat and PM₂.₅
By Collins Odhiambo | DatalytIQs Academy
1. Introduction: When Weather Meets Air Quality
Every season tells a story — not just through changing skies, but through the air we breathe.
This month’s DatalytIQs Academy analysis explores how temperature and fine particulate matter (PM₂.₅) vary across months, revealing a fascinating dance between climate and pollution.
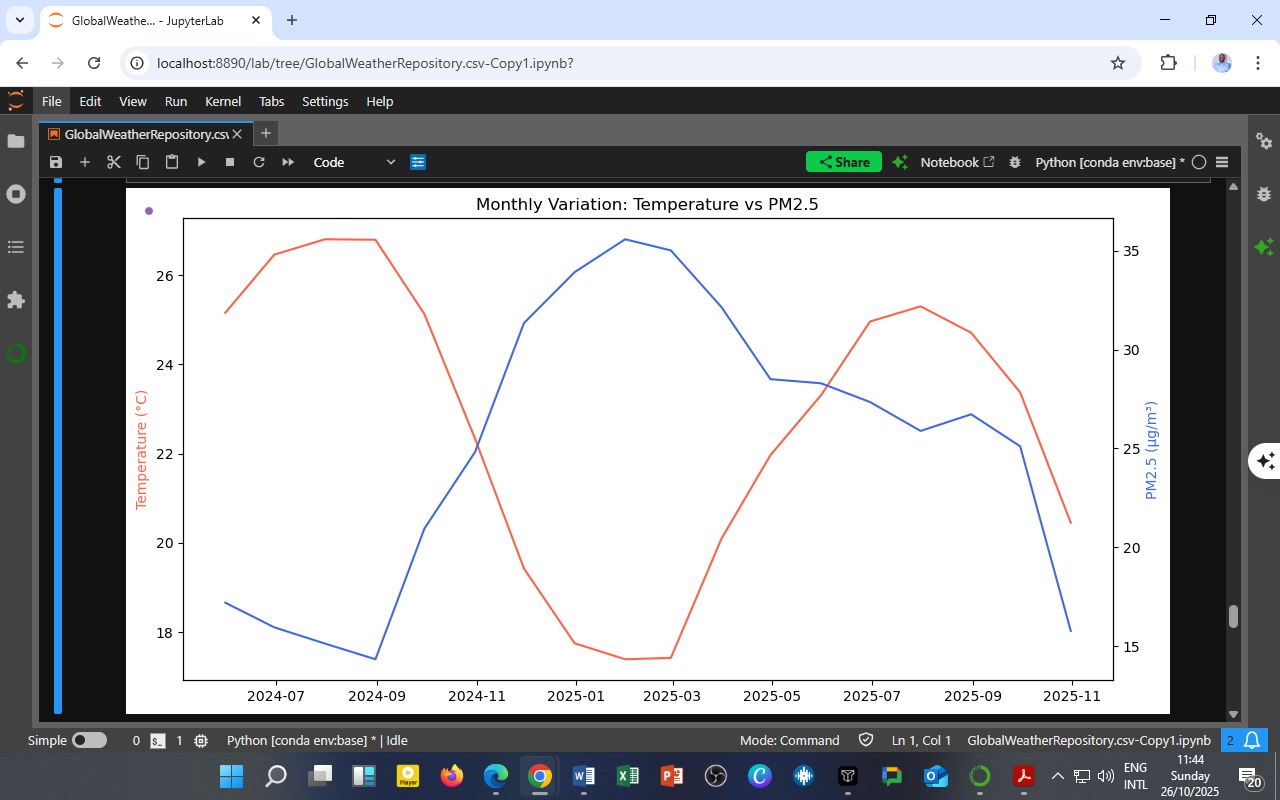
The figure below, generated in Python (JupyterLab), visualizes this dynamic interaction:
Chart Title: Monthly Variation: Temperature vs PM₂.₅
Temperature (°C) — red line (left axis)
PM₂.₅ (µg/m³) — blue line (right axis)

2. Interpreting the Trends
Temperature Pattern
-
Rises steadily from mid-year (June–August), peaking around September–October.
-
Drops sharply during the cool season (December–March), reaching a minimum around February–March.
-
Gradually rebounds into the next warm cycle (April–June).
This cyclical pattern reflects the seasonal energy balance — with solar radiation and atmospheric circulation shaping thermal conditions.
PM₂.₅ Pattern
-
Inverse to temperature: high concentrations during cooler months (Nov–March) and low levels during warmer months (July–October).
-
Peaks correspond to stable atmospheric conditions, low wind speeds, and reduced vertical mixing, which trap pollutants near the surface.
3. The Inverse Relationship Explained
The anti-correlation between temperature and PM₂.₅ suggests that meteorological factors significantly control pollution dispersion.
| Temperature Phase | PM₂.₅ Response | Mechanism |
|---|---|---|
| Warm months (high T°) | Low PM₂.₅ | Enhanced mixing, stronger convection, better pollutant dispersion |
| Cool months (low T°) | High PM₂.₅ | Inversions, weak winds, poor dispersion, and increased emissions from heating or biomass burning |
Scientific Insight:
As air warms, it expands and rises — improving air circulation and diluting pollutants.
When air cools, it becomes dense and traps emissions, worsening air quality.
4. Implications for Air Quality and Health
Morning & Evening Exposure
Cooler temperatures, often linked with temperature inversions, can increase surface-level PM₂.₅ exposure, especially for pedestrians and cyclists.
Urban Vulnerability
Cities with dense traffic, industrial zones, or biomass energy use experience amplified winter pollution, leading to respiratory and cardiovascular health risks.
Seasonal Monitoring Importance
Continuous data tracking ensures pollution mitigation strategies align with meteorological cycles — not just annual averages.
5. Policy and Planning Insights
1. Time-Specific Emission Control
-
Winter months (Nov–Mar): Enforce stricter emission controls, promote clean cooking fuels, and regulate open burning.
-
Summer months (Jun–Oct): Encourage outdoor activities and green public transit use when air quality improves.
2. Data-Driven Transport Scheduling
Cities can stagger traffic or encourage public transport during pollution-heavy months to reduce PM₂.₅ buildup.
3. Urban Greening and Heat Islands
Vegetation improves both air quality and thermal comfort — offering dual mitigation benefits for heat and pollution.
4. Integration with SDGs
| SDG | Focus | Application |
|---|---|---|
| SDG 3 – Good Health | Reducing PM₂.₅-related diseases | Air-quality alerts and health advisories |
| SDG 11 – Sustainable Cities | Cleaner transport and urban air | Seasonal emission management |
| SDG 13 – Climate Action | Linking pollution and temperature data | Local adaptation strategies |
6. Educational Insight: Why This Matters
For students and researchers, this case demonstrates:
-
How climate variables (like temperature) influence air pollution trends.
-
Why data visualization and statistical correlation matter in environmental analytics.
-
The power of Python-based data science in uncovering hidden atmospheric relationships.
7. Conclusion: A Seasonal Balance We Must Respect
Temperature and PM₂.₅ share a see-saw relationship — one rises as the other falls.
By understanding this interplay, policymakers, scientists, and citizens can anticipate pollution risks, adapt city life, and align environmental health actions with nature’s cycles.
Author
Written by Collins Odhiambo
Data Analyst | Educator
DatalytIQs Academy — Where Data Meets Discovery.
Data: Global Weather Repository.
Leave a Reply
You must be logged in to post a comment.