In cardiovascular diagnostics, subtle patterns in the ST segment of an electrocardiogram (ECG) can reveal profound insights about heart function.
The ST segment slope (ST_Slope) — whether it trends upward, flat, or downward– reflects how the heart’s electrical activity responds after contraction, a critical window for detecting ischemia and other heart conditions.
This visualization examines the relationship between different ST-segment slopes and the presence of heart disease, offering valuable guidance for clinicians, researchers, and health policymakers.
2. Understanding the Visualization

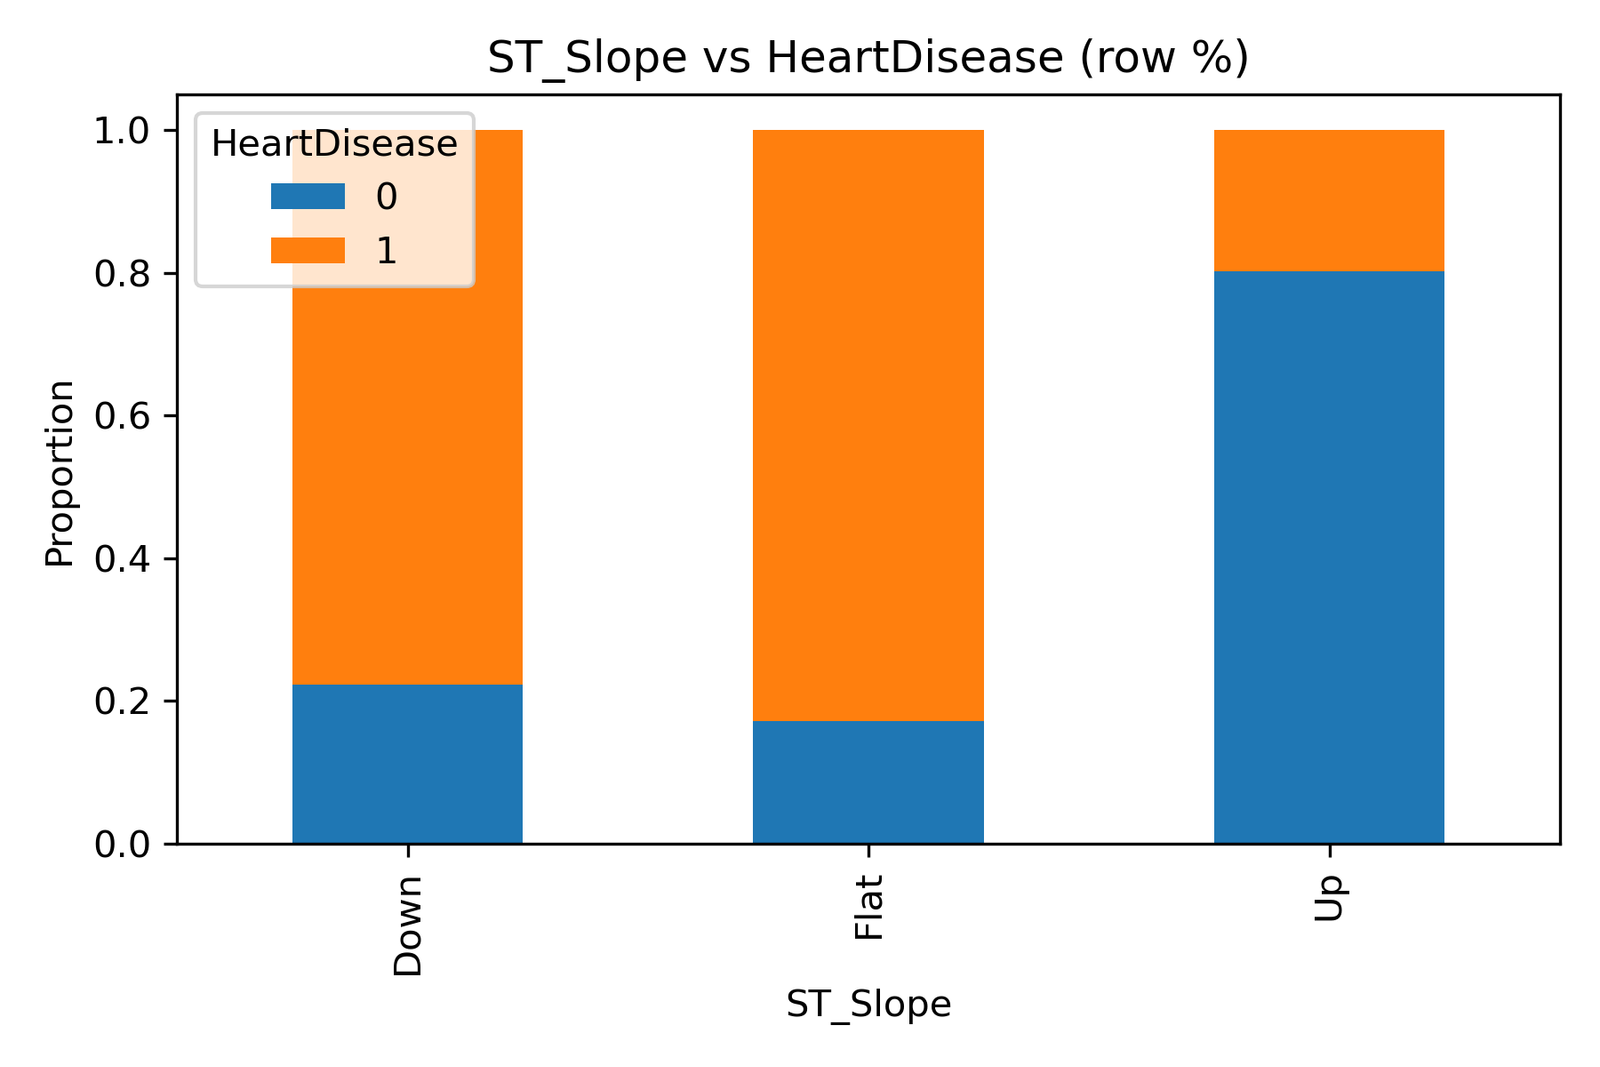
The chart titled “ST_Slope vs HeartDisease (row %)” compares the proportion of individuals with and without heart disease across three ST segment slope categories:
-
Up: Upward slope — often linked to healthy cardiac recovery.
-
Flat: Flat slope — may indicate limited oxygen recovery or ischemic stress.
-
Down: Downward slope — typically associated with severe ischemia or cardiac dysfunction.
The blue portion of each bar represents patients without heart disease (0), while the orange portion indicates those diagnosed with heart disease (1).
3. Key Insights
-
Flat and Down slopes show the highest proportions of heart disease, suggesting compromised cardiac recovery and possible myocardial ischemia.
-
Up slopes correspond to the lowest prevalence of heart disease, reinforcing their association with healthier heart responses during and after stress.
-
The sharp contrast between Flat/Down vs Up underscores the diagnostic value of ECG slope analysis in early heart disease detection.
4. Implications for Clinical Practice and Policy
This evidence underscores that the ST segment slope is not just a technical ECG parameter; it’s a predictive marker of cardiovascular health.
For clinical practice:
-
Routine ECG analysis should emphasize slope interpretation alongside other indicators such as Resting ECG and Exercise Angina.
-
Early detection of Flat or Down slopes can prompt timely interventions, reducing the risk of severe cardiac events.
For policymakers:
-
National heart screening programs should invest in ECG data digitization and AI-based interpretation systems to improve diagnostic precision.
-
Training primary healthcare workers in ECG pattern recognition can significantly expand preventive care in low-resource regions.
5. Analytical Context
The dataset analyzed originates from Kaggle’s open cardiovascular data, processed using Python’s pandas, matplotlib, and seaborn libraries.
The results are presented as row percentages, allowing proportional comparison of heart disease prevalence within each ST slope category.
6. Acknowledgement
This post is part of the DatalytIQs Academy Health Analytics Series, translating real-world data into actionable insights.
Author: Collins Odhiambo Owino
Institution: DatalytIQs Academy — Advancing Analytics in Mathematics, Economics, and Health.
7. Policy Reflection
Data like this bridge the gap between medical science and public policy. By identifying risk profiles from ECG features, health authorities can target preventive care, resource allocation, and public education campaigns more effectively.
At DatalytIQs Academy, we believe that data-driven insight is the first step toward healthier societies.
Leave a Reply
You must be logged in to post a comment.