A Resting Electrocardiogram (ECG) is one of the simplest yet most informative diagnostic tools for detecting heart irregularities. It records the heart’s electrical activity while the patient is at rest and can reveal subtle patterns that point to underlying cardiac issues.
This analysis explores how different ECG readings — Left Ventricular Hypertrophy (LVH), Normal, and ST-T Wave abnormalities (ST), correlate with the likelihood of Heart Disease.
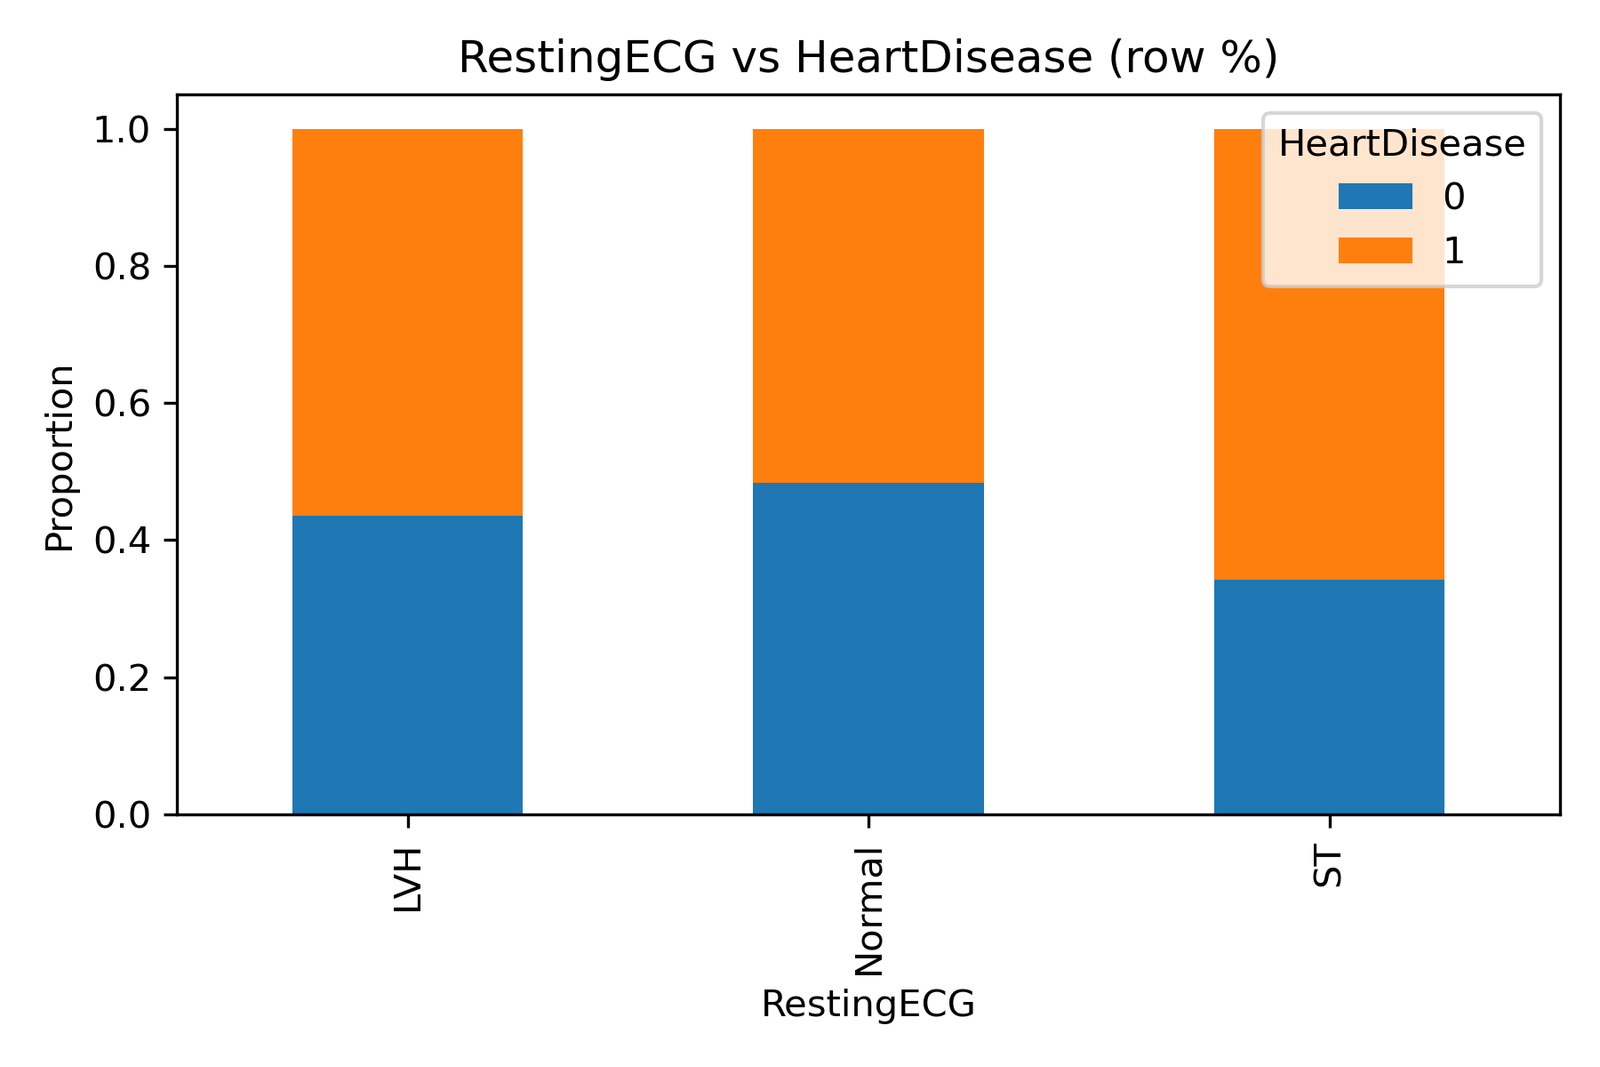
2. Understanding the Visualization

The chart titled “RestingECG vs HeartDisease (row %)” represents proportions of individuals with and without heart disease across three ECG categories:
-
LVH (Left Ventricular Hypertrophy): Thickening of the heart’s left ventricular walls.
-
Normal: Typical, healthy ECG waveform.
-
ST (ST-T Wave Abnormalities): Indicative of possible ischemia or myocardial stress.
The blue sections represent individuals without heart disease (0), while the orange sections denote those diagnosed with heart disease (1).
3. Key Insights
-
Patients with ST-T wave abnormalities show the highest proportion of heart disease, confirming that ECG deviations in repolarization often signal ischemic conditions.
-
Normal ECG results are associated with the lowest probability of disease, though not entirely risk-free, emphasizing the need for broader screening.
-
LVH patients exhibit a moderate risk, consistent with the fact that left ventricular thickening is a strong marker of chronic high blood pressure and long-term cardiac strain.
4. Implications for Clinical Practice and Policy
This evidence highlights the continuing value of ECG screening in preventive healthcare:
-
Routine ECG testing should be included in standard adult health check-ups, especially for those over 40.
-
Health policymakers should promote accessible and affordable ECG testing in primary care and rural health facilities.
-
The Integration of AI-powered ECG interpretation in public hospitals can enhance diagnostic accuracy and early detection, particularly in resource-limited regions.
By identifying abnormalities early, healthcare systems can significantly reduce the burden of cardiovascular mortality.
5. Data and Analytical Methodology
The dataset, sourced from Kaggle’s open cardiovascular data, was analyzed using Python (pandas, matplotlib, seaborn).
Each bar in the visualization represents the proportion of patients diagnosed with or without heart disease, normalized within each ECG category.
This proportional approach ensures comparability across varying sample sizes.
6. Acknowledgement
This work is part of the DatalytIQs Academy Health Analytics Series, which leverages data-driven approaches to decode health patterns and inform better decision-making.
Author: Collins Odhiambo Owino
Institution: DatalytIQs Academy — Bridging Data, Knowledge, and Impact.
7. Policy Reflection
The findings underscore that data analytics is not just about numbers — it’s about saving lives through insight.
National health systems must prioritize data integration, combining routine ECG reports, demographics, and lifestyle indicators to inform predictive health modeling.
Leave a Reply
You must be logged in to post a comment.