Insights from the Global Earthquake–Tsunami Risk Assessment Dataset
Overview
Between 2001 and 2022, Earth experienced several mega-earthquakes—events so powerful that they reshaped coastlines, triggered global tsunamis, and altered the planet’s rotation slightly.
This analysis, conducted using the Global Earthquake–Tsunami Risk Assessment Dataset, identifies and maps the ten most extreme earthquakes (≥ 8.5 M) recorded worldwide.
The visualization highlights where and how these seismic giants occur, emphasizing their link to tectonic subduction zones—regions where oceanic plates dive beneath continental crust.
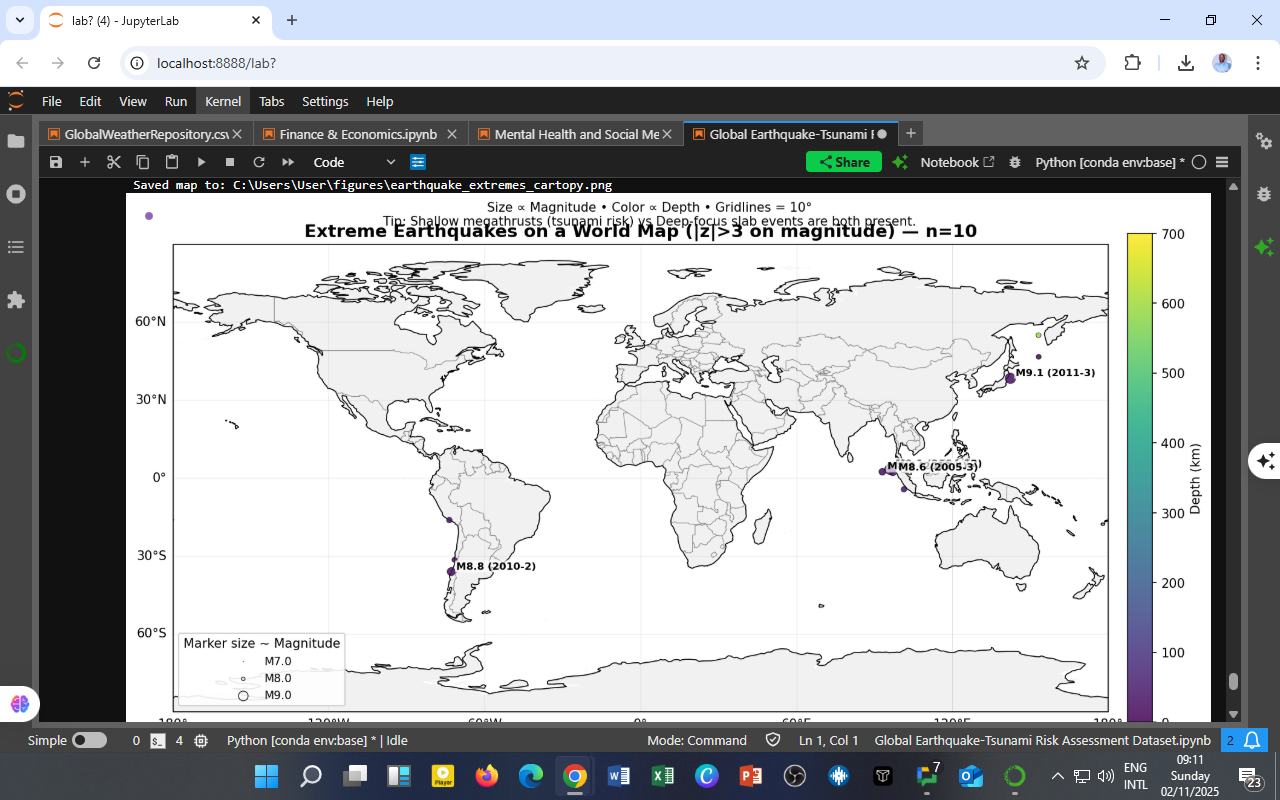
Global Distribution of Extreme Earthquakes

Figure Description
-
Marker size ∝ Magnitude (larger circles represent stronger quakes).
-
Color ∝ Depth (km) (lighter tones = deeper events).
-
Labels indicate event magnitude and year (e.g., M 9.1 (2011-3) = Japan, March 2011).
-
Gridlines: 10° intervals for latitude/longitude.
Notable Mega-Earthquakes
| Year | Magnitude | Region | Notes |
|---|---|---|---|
| 2004 (Dec) | 9.1 M | Sumatra–Andaman Islands | Generated a catastrophic Indian Ocean tsunami; > 230 000 fatalities. |
| 2005 (Mar) | 8.6 M | Northern Sumatra | A major aftershock of the 2004 event caused further tsunami waves. |
| 2010 (Feb) | 8.8 M | Maule, Chile | Triggered a Pacific-wide tsunami, one of the largest recorded in South America. |
| 2011 (Mar) | 9.1 M | Tōhoku, Japan | Produced a devastating tsunami and the Fukushima nuclear disaster. |
| 2012 (Apr) | 8.6 M | Indian Ocean (off Sumatra) | Unusual strike-slip “intraplate” quake far from typical subduction zones. |
Spatial Insights
-
Tectonic Concentration:
Every extreme earthquake lies along an active plate boundary, primarily the Pacific Ring of Fire, stretching from Chile through Indonesia to Japan. -
Subduction Zone Dominance:
All megaquakes originated where oceanic crust subducts beneath continental plates, confirming that compressional forces drive the largest seismic releases. -
Depth Contrast:
The color scale reveals both shallow (≤ 70 km) and deep (> 500 km) events, showing that catastrophic quakes can occur throughout the subducting slab’s thickness. -
Tsunami Correlation:
Nearly all mapped events generated significant tsunami activity, reinforcing the link between shallow megathrust earthquakes and oceanic wave hazards.
Interpretation
The spatial clustering of extreme earthquakes demonstrates that global seismic energy release is not random but structurally controlled by plate boundaries.
These regions represent the planet’s pressure valves, releasing energy accumulated over decades or even centuries.
“The Earth’s mightiest quakes are the signatures of its living crust — sudden releases of centuries-old tension.”
Applications
-
Risk Mapping: Supports identification of global seismic hot-spots.
-
Tsunami Early Warning: Helps refine models predicting ocean-wave generation zones.
-
Educational Value: Provides a visual, data-driven tool for teaching plate tectonics.
-
Policy Insight: Reinforces the need for regional preparedness across coastal Pacific nations.
Acknowledgment
This analysis was performed by DatalytIQs Academy, an education and analytics platform advancing data-driven learning in Mathematics, Economics, and Earth Science.
Dataset: Kaggle — Global Earthquake–Tsunami Risk Assessment Dataset (2001 – 2022)
Tools Used: Python | Cartopy | Matplotlib | Pandas | JupyterLab
“At DatalytIQs Academy, we turn seismic data into global foresight — empowering resilience through analytics.”
— Collins Odhiambo Owino, Founder
Acknowledgment of Contributions:
We gratefully acknowledge the open-data science community and Kaggle contributors for providing high-quality seismic datasets and tools that make global disaster research possible.
Leave a Reply
You must be logged in to post a comment.