Overview
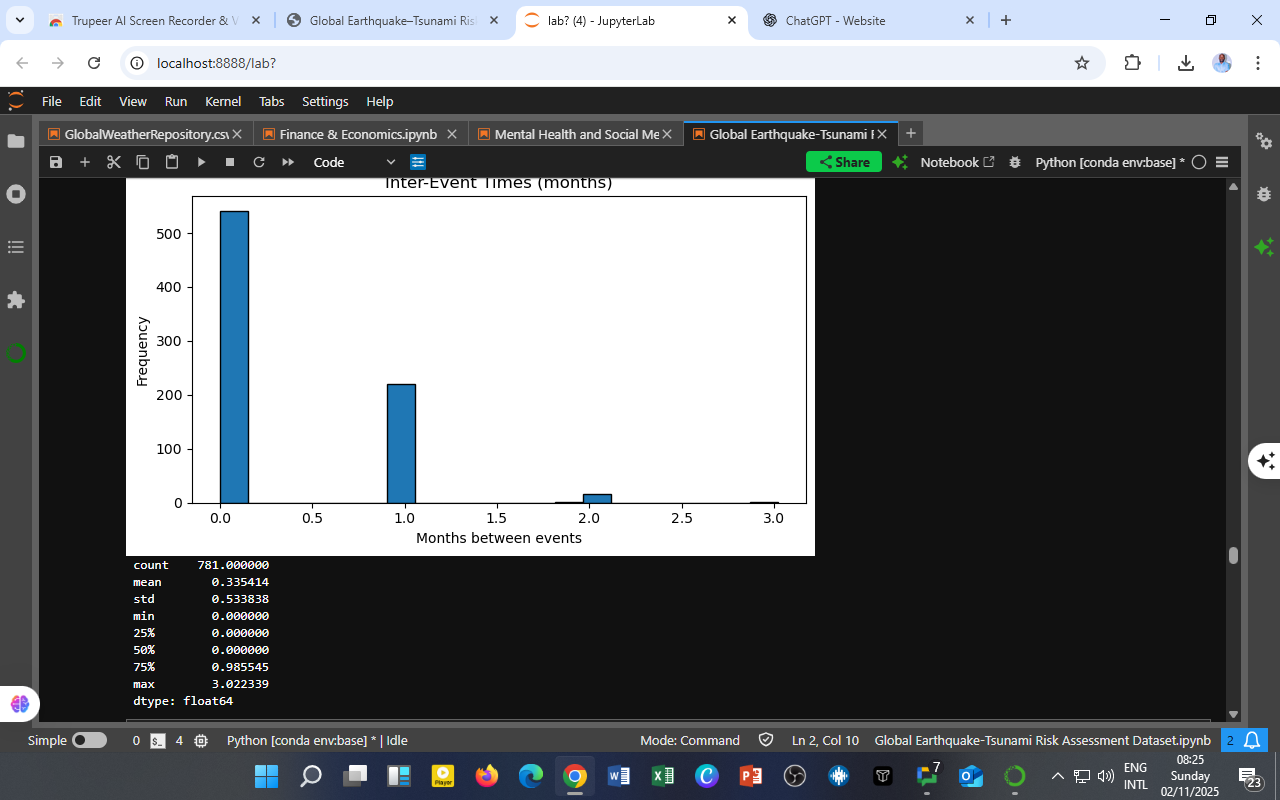
The Inter-Event Time Analysis measures the interval between successive global earthquakes, expressed in months.
Using the Global Earthquake–Tsunami Risk Assessment Dataset (2001 – 2022), this visualization explores how frequently large-magnitude seismic events occur worldwide.
The analysis reveals how tightly earthquakes are clustered over time — an important metric for understanding global seismic rhythm and for developing risk models and early-warning strategies.
Inter-Event Time Distribution

Statistical Summary
| Metric | Value |
|---|---|
| Count | 781 |
| Mean | 0.34 months |
| Standard Deviation | 0.53 |
| Minimum | 0.00 |
| 25th Percentile | 0.00 |
| Median (50 %) | 0.00 |
| 75th Percentile | 0.99 |
| Maximum | 3.02 months |
Interpretation
-
Most global earthquakes occur within the same month.
The median value of 0 months indicates that multiple significant earthquakes frequently happen in a very short time frame. -
Temporal clustering dominates global seismic activity.
Over half of all earthquakes occur close together, suggesting sequences of aftershocks or near-simultaneous activity along different tectonic boundaries. -
Longer gaps are rare.
Only a few events show intervals greater than one month, implying that the planet’s tectonic energy release is continuous but uneven. -
Mean inter-event time ≈ 0.34 months (around 10 days).
This demonstrates that, on average, a strong earthquake occurs somewhere on Earth roughly every week to ten days.
“Earthquakes don’t keep time — they cluster, pulse, and echo through the planet’s crust.”
Implications
-
Early-Warning Systems:
Understanding inter-event clustering helps refine forecasting algorithms, distinguishing between isolated quakes and series likely to trigger secondary hazards. -
Policy and Planning:
Regions within active tectonic belts can design emergency readiness cycles that match the typical recurrence rhythm of seismic energy release. -
Data Science Applications:
The pattern supports Poisson-process and time-series modeling approaches for predicting global seismic frequencies.
Acknowledgment
This analysis was conducted by DatalytIQs Academy, a global educational and research platform empowering learners in Mathematics, Economics, and Earth-Science Analytics.
Dataset: Global Earthquake–Tsunami Risk Assessment Dataset (2001 – 2022) — sourced from Kaggle.
Tools Used: Python | Pandas | Matplotlib | Seaborn | JupyterLab
“At DatalytIQs Academy, we translate seismic patterns into insights that strengthen global resilience.”
— Collins Odhiambo Owino, Founder
Acknowledgment of Contributions:
Special appreciation to the open-data science community and Kaggle contributors whose transparent data sharing made this research possible.
Leave a Reply
You must be logged in to post a comment.