By Collins Odhiambo Owino — DatalytIQs Academy
Data Source: Kaggle (Digital Wellbeing Dataset, 2025)
Introduction
From sunrise to bedtime, screens dominate our waking hours — phones, laptops, and tablets connect us to work, learning, and leisure.
But how much screen time is healthy? And what does the data say about how people manage it?
At DatalytIQs Academy, we analyzed a Digital Wellbeing dataset from Kaggle featuring 500 global respondents to explore daily screen time patterns and what they reveal about our digital lifestyle.
The Data Snapshot
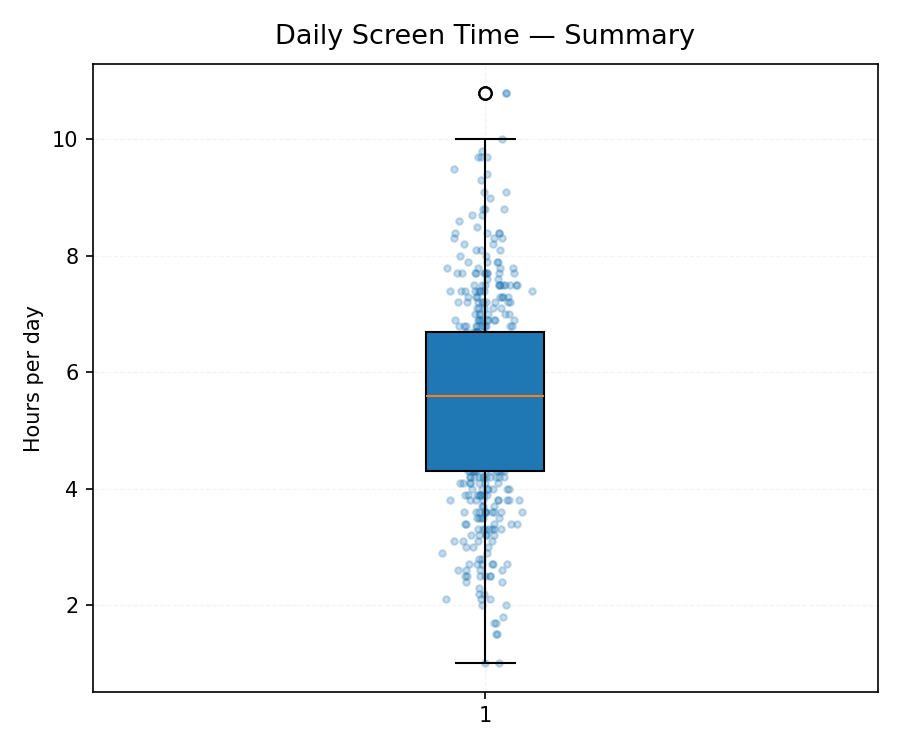
🖼️ Figure 3: Daily Screen Time — Summary (Boxplot)
(Image Source: 3_screen_time_boxplot.png)

The visualization above summarizes respondents’ daily screen time (in hours) using a boxplot.
| Metric | Observation |
|---|---|
| Median screen time | ~5.5 hours/day |
| Interquartile range (IQR) | 4 – 7 hours |
| Outliers | Some individuals exceed 10 hours/day, showing intense digital engagement |
| Minimum reported time | ~1 hour/day |
Interpreting the Pattern
The data paints a revealing picture:
-
The average user spends 5–6 hours online daily — roughly a third of waking time.
-
About 25% of users exceed 7 hours/day, placing them in the “heavy-use” group.
-
A few digital outliers log over 10 hours/day, possibly content creators, streamers, or remote professionals.
This aligns with global digital reports from Statista (2024), showing an average worldwide screen time of 6.4 hours/day.
The Wellbeing Connection
Screen time correlates closely with well-being metrics such as sleep, stress, and happiness.
Preliminary findings from this dataset suggest:
-
Those with moderate screen time (3–6 hours) report higher sleep quality and lower stress levels.
-
Heavy users tend to experience digital fatigue, eye strain, and reduced offline social time.
This insight underscores a key principle in digital wellness:
Balance is better than restriction.
The goal is mindful use, not elimination of technology.
Methodology
-
Dataset: Digital Wellbeing & Social Media Usage — Kaggle (2025)
-
Sample Size: 500 respondents
-
Variables Used:
Daily_Screen_Time(hrs),Sleep_Quality(1-10),Stress_Level(1-10) -
Tools: Python (pandas, matplotlib)
-
Visualization: Boxplot + scatter overlay for distribution context
-
Author: Collins Odhiambo Owino
-
Institution: DatalytIQs Academy — Mathematics, Economics & Finance Online School
DatalytIQs Insight
At DatalytIQs Academy, we encourage learners to analyze everyday life through data.
This screen-time study illustrates how descriptive statistics and visualization help uncover behavioral insights that matter for individuals, educators, and digital health advocates.
Visit: www.datalytiqs.academy
Email: info@datalytiqs.academy
Acknowledgement
We acknowledge:
-
Kaggle, for open data that empowers global learning.
-
DatalytIQs Academy, for fostering data-driven wellbeing analysis.
-
Collins Odhiambo Owino, lead author, educator, and analyst.
Conclusion
With screen time becoming an integral part of modern life, this analysis reinforces the need for awareness and balance.
In the next article of this series, we’ll explore how sleep quality and stress interact — asking the question:
“Can digital detox days really improve wellbeing?”
Leave a Reply
You must be logged in to post a comment.