Attendance is more than a statistic; it’s a reflection of discipline, motivation, and commitment to learning.
Using data from the Kaggle — student_exam_scores.csv dataset, this analysis visualizes student attendance rates to understand classroom participation patterns and their possible link to academic outcomes.
Understanding the Distribution

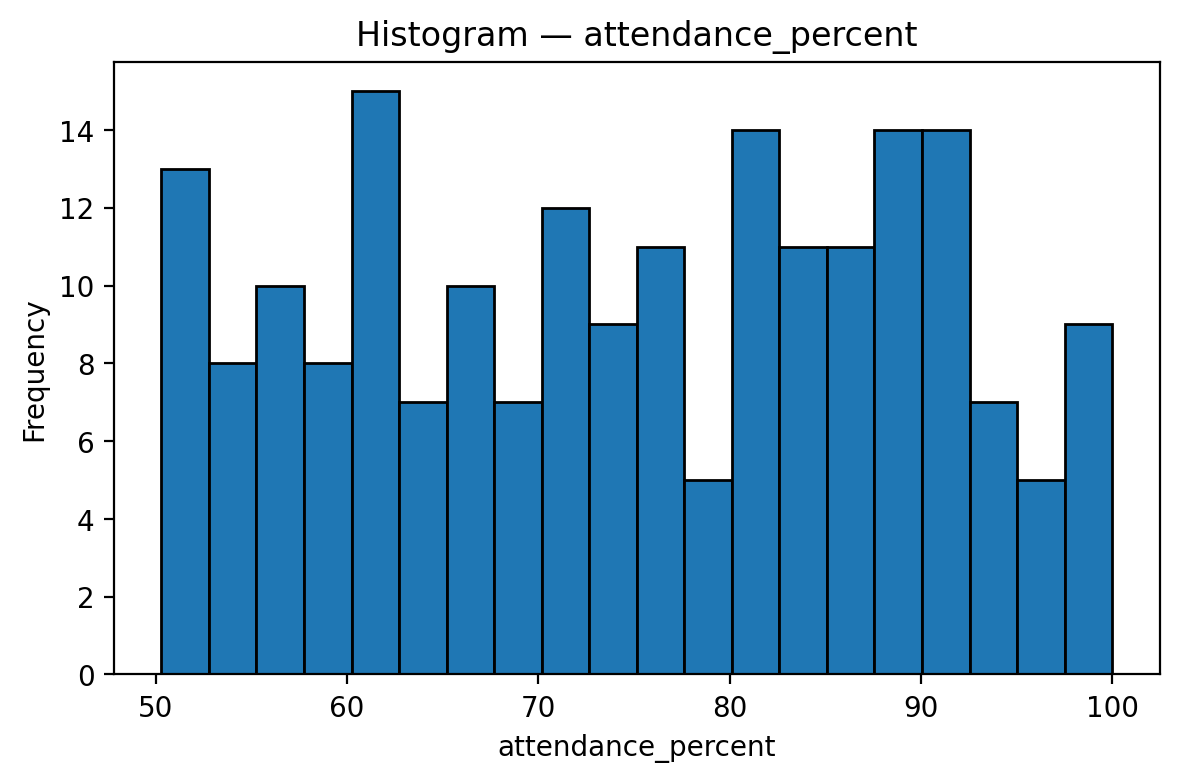
The histogram illustrates the distribution of student attendance between 50% and 100%.
Unlike exam scores, attendance data appears fairly uniform, meaning that students are spread across various attendance levels with no single dominant peak.
Key observations include:
-
Most students attend classes regularly, with many recording attendance rates between 70% and 95%.
-
A few students fall below 60%, signaling potential disengagement or barriers to consistent attendance.
-
High attendance rates(above 90%) are evident among a significant number of learners, a positive indicator of academic reliability.
Interpretation
-
Balanced Participation:
The roughly uniform distribution suggests that while attendance varies, most students maintain reasonable consistency. -
At-Risk Group:
Those below 60% attendance might struggle academically or face external challenges affecting participation. -
Exemplary Attendance:
Learners with attendance above 90% likely exhibit strong time management and study discipline — attributes that often translate into higher exam performance.
Educational Insights
| Observation | Implication | Recommendation |
|---|---|---|
| The attendance spread is wide | Students differ in engagement levels | Implement follow-up systems for low attenders |
| Majority above 70% | Good classroom commitment | Reinforce attendance policies to maintain the trend |
| Few below 60% | Risk of academic decline | Provide mentorship, counseling, or support programs |
Implications for Schools and Policymakers
Consistent attendance remains a core predictor of academic success.
Educational institutions can use attendance analytics to:
-
Detect early signs of academic risk,
-
Design reward systems for consistency, and
-
Align attendance tracking with performance monitoring systems.
When attendance data is combined with exam results, educators can develop more personalized interventions that turn data into action, ensuring no student is left behind.
Acknowledgment
Data Source: Kaggle — student_exam_scores.csv
Analysis and Visualization: Education Analytics Unit, DatalytIQs Academy (2025)
Leave a Reply
You must be logged in to post a comment.