In education, numbers don’t just measure performance; they tell stories.
At DatalytIQs Academy, we believe that every dataset is a mirror of learning behavior. The histogram below, based on the Kaggle student_exam_scores.csv dataset, explores how students perform under similar conditions and what their score patterns reveal about study habits, understanding, and classroom effectiveness.
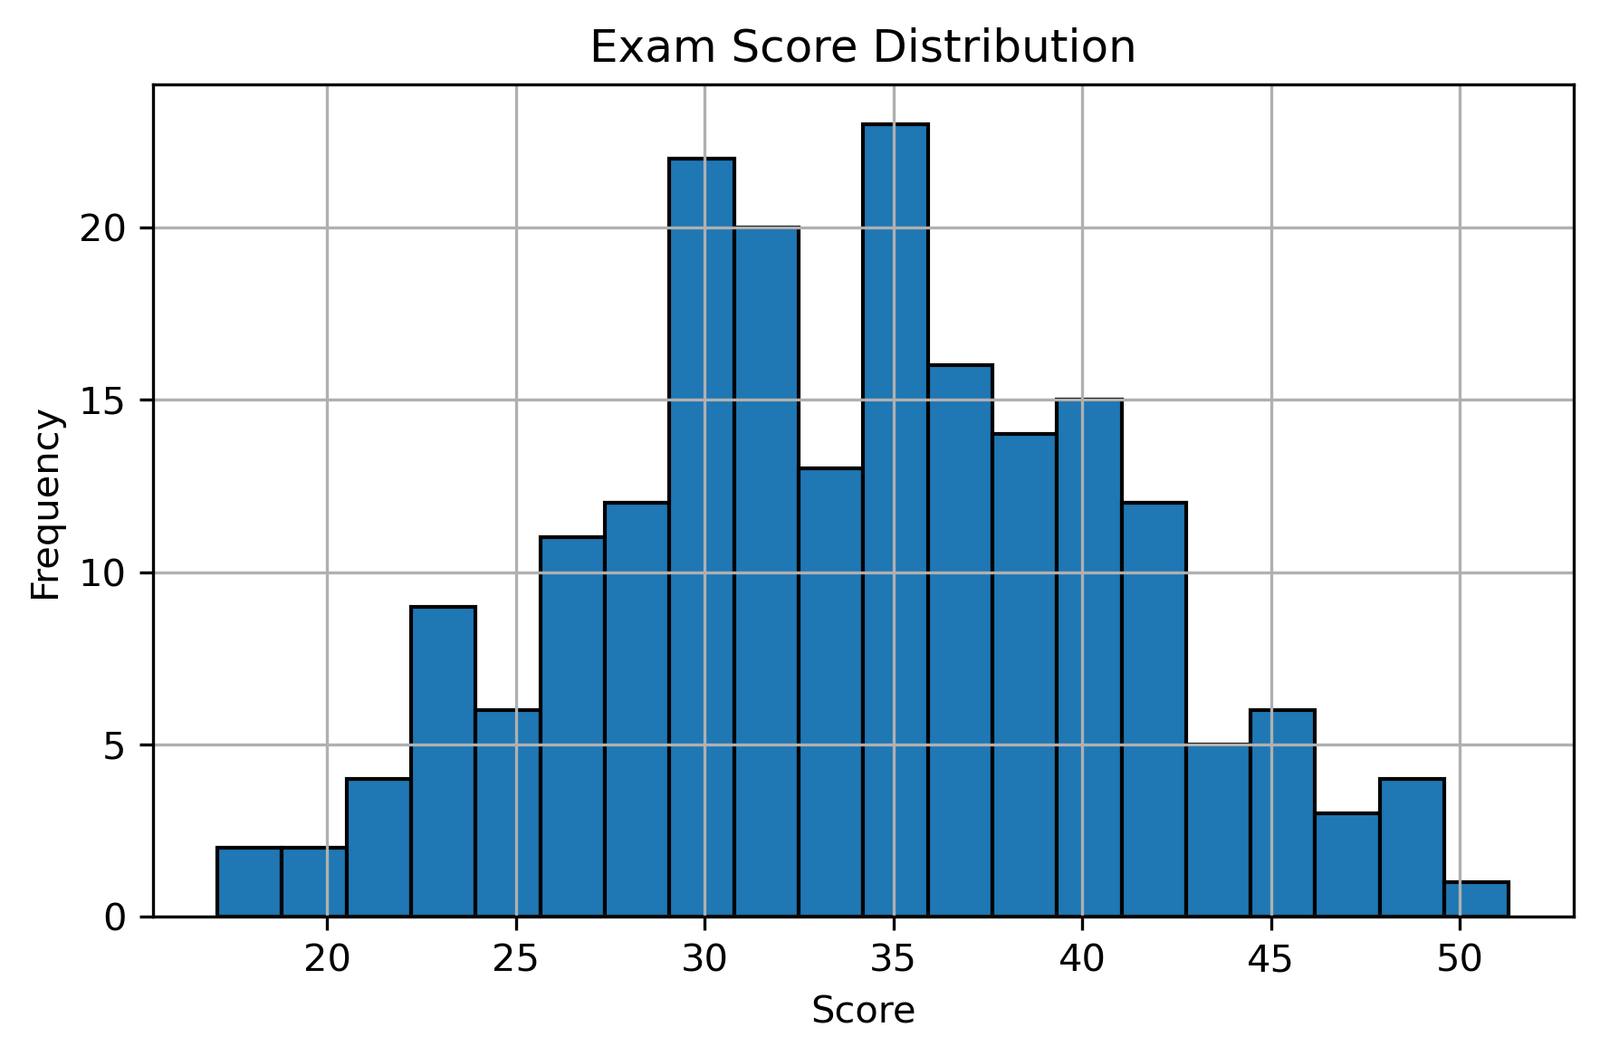
Exam Score Distribution

The histogram illustrates the distribution of exam scores across the student population.
Most students scored between 30 and 36, forming a central cluster that represents moderate performance. A smaller number of students achieved above 45, while a few scored below 25, creating the tails of the distribution.
This pattern suggests that while teaching has been broadly effective, variability in performance still exists; some students excel, while others need additional support.
Interpretation
-
Central Concentration:
The scores peak around 33–35, reflecting a balanced level of achievement across most learners. -
Lower Tail:
A minority of students scoring below 25 may indicate learning challenges, poor attendance, or difficulties with studying. -
Upper Tail:
The few who score above 45 demonstrate strong comprehension and consistent study habits.
Educational Insights
| Observation | Interpretation | Recommended Action |
|---|---|---|
| The majority is near the average | Consistent teaching outcomes | Reinforce current curriculum delivery and maintain engagement |
| Low-performing group present | Signs of learning gaps | Introduce remedial lessons, mentorship, or personalized coaching |
| A few high achievers | Advanced understanding | Offer enrichment or peer-tutoring programs to stretch potential |
Implications for Educators and Policy
Data-driven analysis like this empowers educators to visualize learning outcomes, identify performance clusters, and design interventions based on real evidence.
Repeating such studies over multiple terms can help track improvements and measure the impact of curriculum changes or study strategies.
Acknowledgment
Data Source: Kaggle — student_exam_scores.csv
Analysis and Visualization: Education Analytics Unit, DatalytIQs Academy (2025)
Leave a Reply
You must be logged in to post a comment.