Cholesterol plays a crucial role in cardiovascular health. While it is essential for hormone production and cell function, excessive levels increase the risk of artery blockage and heart disease.
This visualization examines the distribution of cholesterol levels among patients in a heart disease dataset, helping to reveal population health patterns and potential diagnostic red flags.
2. The Visualization Explained

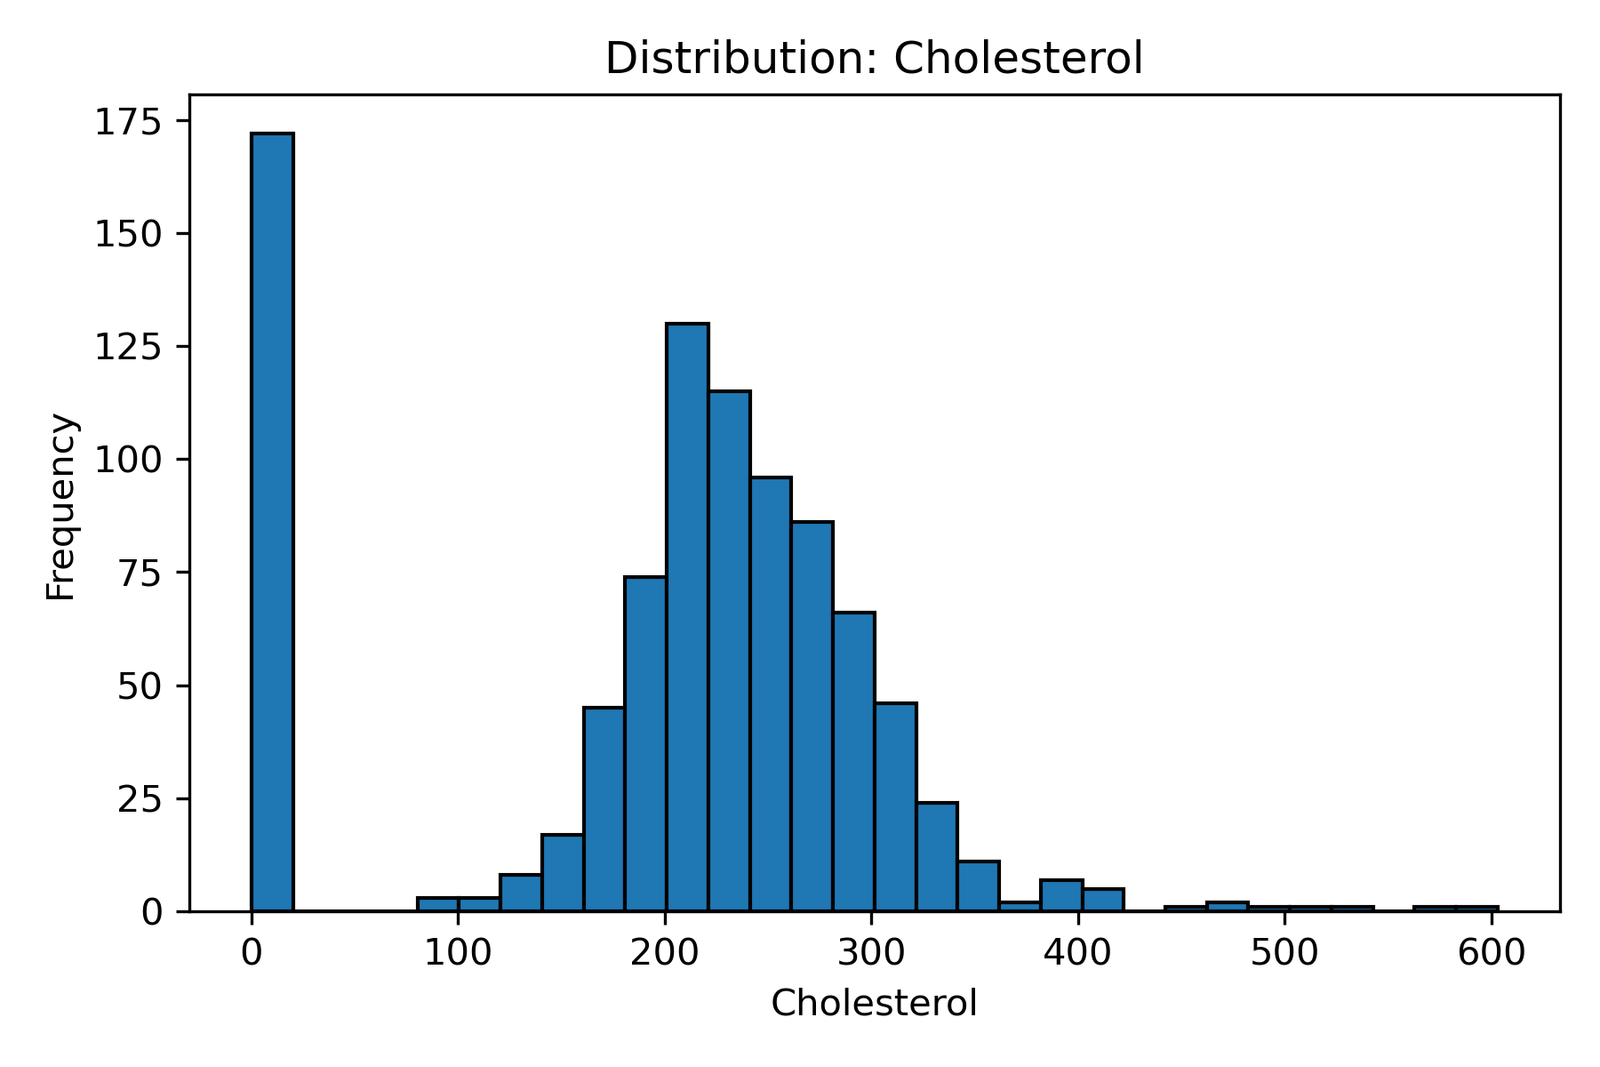
The histogram titled “Distribution: Cholesterol” displays how cholesterol levels are distributed across the study population.
-
The x-axis represents cholesterol levels (mg/dL).
-
The y-axis represents the number of individuals (frequency) within each cholesterol range.
3. Key Insights
-
A cluster of cases around 200–250 mg/dL indicates that most patients fall within or slightly above the borderline high cholesterol range, consistent with real-world health data.
-
The peak frequency near 220 mg/dL suggests that mild hypercholesterolemia is common, warranting lifestyle or medical intervention.
-
The long right tail (values above 300 mg/dL) highlights a smaller subset of patients with severe hypercholesterolemia, at high risk for atherosclerosis and coronary complications.
-
The spike at zero likely represents missing or unrecorded data, emphasizing the importance of robust data collection in clinical studies.
4. Public Health and Policy Implications
This distribution underscores the need for population-level cholesterol screening and targeted prevention programs.
Policy implications include:
-
Implementing routine cholesterol testing in adults over 30 years old.
-
Promoting dietary interventions (low saturated fats, high fiber, plant sterols).
-
Integrating cholesterol control targets into national non-communicable disease (NCD) strategies.
-
Leveraging data analytics to identify high-risk clusters for early intervention.
5. Analytical Notes
This analysis used data sourced from Kaggle’s open cardiovascular dataset, processed in Python with pandas and matplotlib.
The distribution helps detect both data anomalies (e.g., missing values at zero) and real-world trends (e.g., the prevalence of high cholesterol levels).
6. Acknowledgement
This post is part of the DatalytIQs Academy Health Analytics Series, dedicated to transforming open data into actionable insights for better policy and preventive healthcare.
Author: Collins Odhiambo Owino
Institution: DatalytIQs Academy — Bridging Data, Mathematics, Economics, and Health Analytics.
7. Policy Reflection
Cholesterol management is both a clinical and societal priority.
By using analytics to understand population patterns, we can guide national efforts in health education, early detection, and data-driven intervention planning.
At DatalytIQs Academy, we champion the belief that data saves lives when interpreted with purpose.
Leave a Reply
You must be logged in to post a comment.