By Collins Odhiambo | DatalytIQs Academy
1. The Chemistry of Daylight
Every sunrise triggers a silent but powerful atmospheric reaction.
In urban environments, ozone (O₃) and nitrogen dioxide (NO₂) engage in a photochemical tug-of-war — one produced as the other fades.
This ratio, O₃/NO₂, is a key indicator of photochemical smog activity, helping us understand when and how the air transitions from traffic-driven pollution to sunlight-driven chemistry.
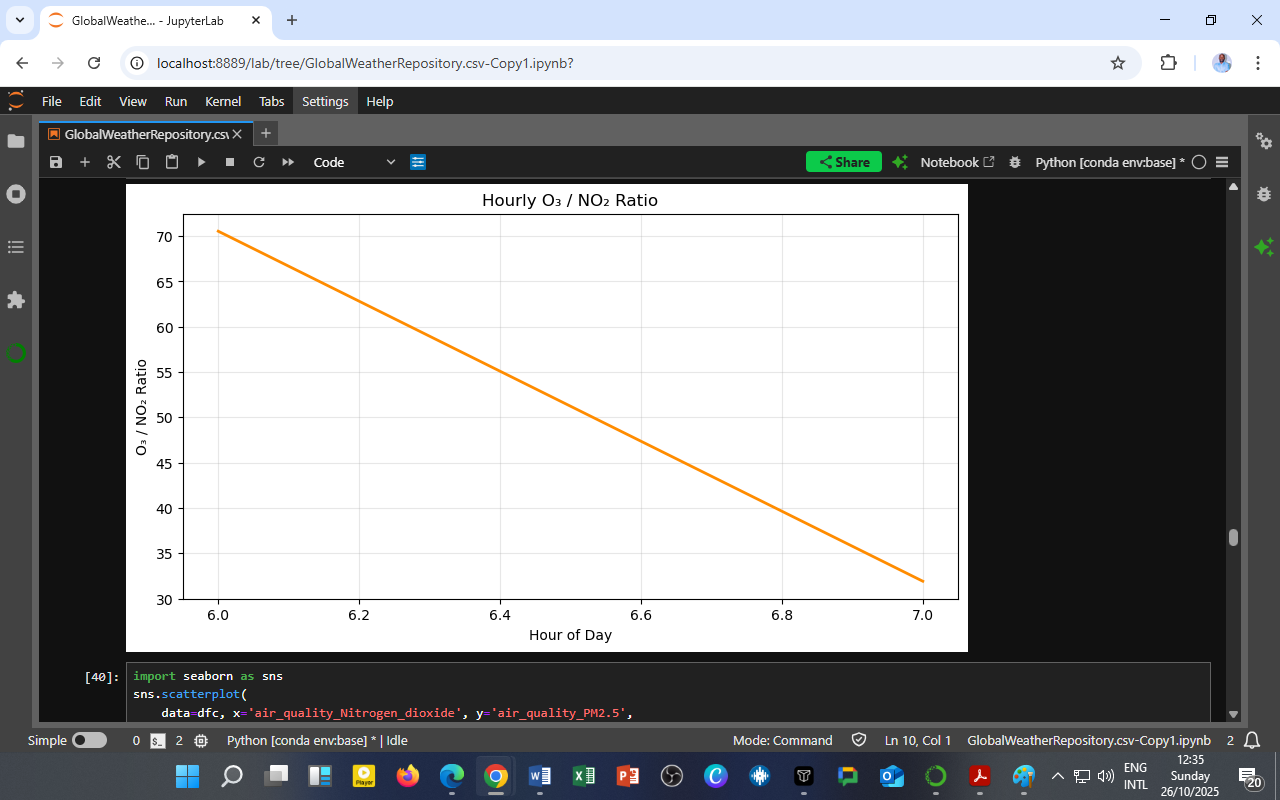
📊 Chart: Hourly O₃/NO₂ Ratio
🟧 Line — O₃ divided by NO₂ (hourly values)

2. Interpreting the Chart
The plotted line shows how the O₃/NO₂ ratio changes between 6:00 and 7:00 a.m., a critical transition period in the morning atmosphere.
Observations:
-
The ratio decreases sharply from around 70 to 30 as the hour progresses.
-
This means NO₂ concentrations rise faster than O₃ formation in the early hours.
At dawn, photolysis (sunlight-driven reactions) has just begun, but the traffic surge rapidly injects NO₂ into the atmosphere.
As a result, ozone remains limited due to its consumption by freshly emitted NO (via titration):
The steep drop in the O₃/NO₂ ratio captures this moment — the city waking up chemically.
3. Why the O₃/NO₂ Ratio Matters
The O₃/NO₂ ratio provides insight into atmospheric reactivity, pollution dominance, and urban air chemistry balance.
| Ratio Range | Atmospheric Interpretation | Dominant Process |
|---|---|---|
| < 10 | Traffic/NOx-dominated regime | Fresh emissions, titration of O₃ |
| 10–50 | Transitional zone | Early photochemistry starting |
| > 50 | Photochemical O₃ formation is dominant | Strong sunlight, low NO₂ |
In this case, the drop from ~70 → 30 suggests a shift from O₃ dominance (night carryover) to NO₂ dominance (morning emissions) — a classic signature of urban dawn chemistry.
4. Atmospheric Processes at Play
Early Morning (Before 7:00)
-
Weak sunlight; little photolysis.
-
Residual O₃ from the previous day still lingers aloft.
-
A rapid increase in vehicle emissions injects NO and NO₂.
-
Result: O₃ is consumed → ratio drops.
Midday (After 9:00)
-
Sunlight intensifies.
-
NO₂ photolyzes, producing oxygen radicals that generate new O₃.
-
The O₃/NO₂ ratio rises again — marking the start of the photochemical ozone cycle.
Nighttime (After Sunset)
-
No photolysis; O₃ reacts with NO and surfaces.
-
Ratio typically declines again toward zero.
5. Policy and Environmental Relevance
Understanding this ratio aids real-time air quality management and pollution source attribution.
1. Traffic Regulation
Morning rush hours are NO₂-dominant, contributing heavily to primary pollution.
Cities can mitigate this with low-emission zones or clean-mobility hours.
2. Photochemical Pollution Forecasting
Rising daytime O₃/NO₂ ratios indicate smog potential, essential for issuing health advisories.
3. Climate and Energy Integration
These ratios also link air pollution with radiative forcing and urban heat, critical for climate resilience planning.
6. Educational Takeaway for DatalytIQs Academy Learners
This analysis illustrates how a single ratio — O₃/NO₂ — encapsulates:
-
The chemical transformation of air pollutants throughout the day,
-
The interaction between sunlight, emissions, and atmospheric stability, and
-
The power of data-driven environmental science.
At DatalytIQs Academy, learners use Python and real-world datasets to model such relationships, gaining hands-on experience in air-quality forecasting and climate analytics.
7. Conclusion: The Dawn of Chemical Insight
The O₃/NO₂ ratio offers a window into the invisible mechanics of city air.
Each sunrise is a new atmospheric experiment — driven by engines, sunlight, and chemistry.
By tracking this balance, we can better predict pollution peaks, design cleaner cities, and build environmental awareness grounded in data.
Data Source
Dataset: GlobalWeatherRepository.csv
Variables Used: Hourly averages of O₃ (µg/m³) and NO₂ (µg/m³)
Derived Metric: O₃/NO₂ ratio (unitless)
Data Period: 2024–2025
Source: DatalytIQs Academy – Global Weather and Air Quality Repository
Processing Tools: Python (pandas, matplotlib, seaborn) in JupyterLab
Location of Analysis: DatalytIQs Environmental Analytics Lab, Kisumu, Kenya
Author
Written by Collins Odhiambo
Data Analyst & Educator
DatalytIQs Academy – Where Data Meets Discovery.
Leave a Reply
You must be logged in to post a comment.