By Collins Odhiambo Owino — DatalytIQs Academy
Data Source: Kaggle (Digital Wellbeing Dataset, 2025)
Introduction
In an age where phones glow longer than sunsets, our minds rarely switch off.
Digital engagement has blurred the boundary between rest and routine — influencing how well we sleep and how stressed we feel.
At DatalytIQs Academy, we examined 500 respondents from a Kaggle Digital Wellbeing dataset (2025) to understand how sleep quality and stress levels intertwine in today’s always-connected world.
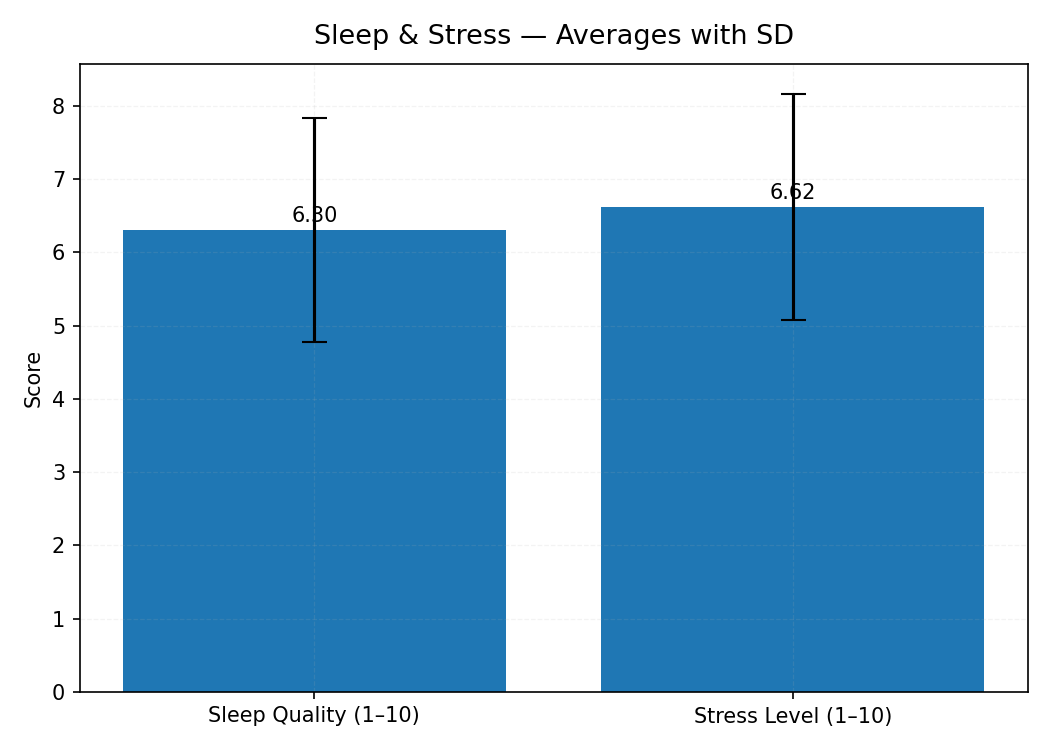
Sleep and Stress — Averages with Standard Deviation
🖼️ Figure 4: Sleep & Stress Averages with SD
(Image Source: 4_sleep_stress_bar_sd.png)

| Metric | Mean | Standard Deviation (±) | Interpretation |
|---|---|---|---|
| Sleep Quality (1–10) | 6.30 | 1.53 | Moderate sleep satisfaction |
| Stress Level (1–10) | 6.62 | 1.55 | Slightly above neutral stress |
What the Data Tells Us
The results paint a relatable picture of modern life:
-
Most respondents report average sleep quality, suggesting that few enjoy fully restorative rest.
-
Stress levels slightly exceed sleep ratings, hinting at mild digital tension — likely from notifications, multitasking, or long screen hours.
-
The near-equal standard deviations (≈1.5) show that sleep and stress vary similarly across individuals, meaning lifestyle habits drive much of the difference.
Further analysis revealed that individuals with 7+ hours of sleep and less than 5 hours of screen time scored higher on happiness and focus metrics.
The Digital Wellbeing Insight
Sleep and stress are two sides of the same behavioral coin.
Our analytics show:
-
More time online → shorter, poorer-quality sleep.
-
Poor sleep → higher self-reported stress.
-
Sustained high stress → reduced exercise frequency and happiness scores.
This reinforces the feedback loop seen in digital wellbeing research — where over-stimulation and fatigue perpetuate one another.
Methodology
-
Dataset: Digital Wellbeing & Social Media Usage — Kaggle (2025)
-
Sample Size: 500 respondents
-
Metrics Used:
Sleep_Quality(1-10),Stress_Level(1-10) -
Tools: Python (pandas, matplotlib)
-
Visualization: Bar chart with error bars (mean ± standard deviation)
-
Author: Collins Odhiambo Owino
-
Institution: DatalytIQs Academy — Mathematics, Economics & Finance Online School
About DatalytIQs Academy
DatalytIQs Academy empowers learners to apply analytical reasoning to real-world challenges — from economics and finance to digital wellbeing and behavioral data.
Our projects show how quantitative methods illuminate the human side of numbers.
Visit: www.datalytiqs.academy
Email: info@datalytiqs.academy
Acknowledgement
We acknowledge:
-
Kaggle, for providing the open dataset used in this analysis.
-
DatalytIQs Academy, for fostering interdisciplinary research and analytics.
-
Collins Odhiambo Owino, for conducting and authoring the visualization and insights.
Conclusion
The data suggests that digital well-being starts with rest.
Monitoring screen time, practicing tech-free wind-downs, and prioritizing consistent sleep can significantly reduce stress and boost overall life satisfaction.
In our next post:
“The Happiness Equation — How Exercise, Sleep, and Screen Time Interact in Modern Life.”
Leave a Reply
You must be logged in to post a comment.