The Oldpeak parameter, also known as ST depression, measures the difference between the resting and peak exercise ST segments in an electrocardiogram (ECG).
It’s a vital clinical marker for evaluating myocardial ischemia, a condition in which the heart muscle receives insufficient oxygen during stress or exertion.
This visualization examines how Oldpeak values differ between individuals with and without heart disease, offering key diagnostic insights for clinicians and data analysts alike.
2. Understanding the Visualization

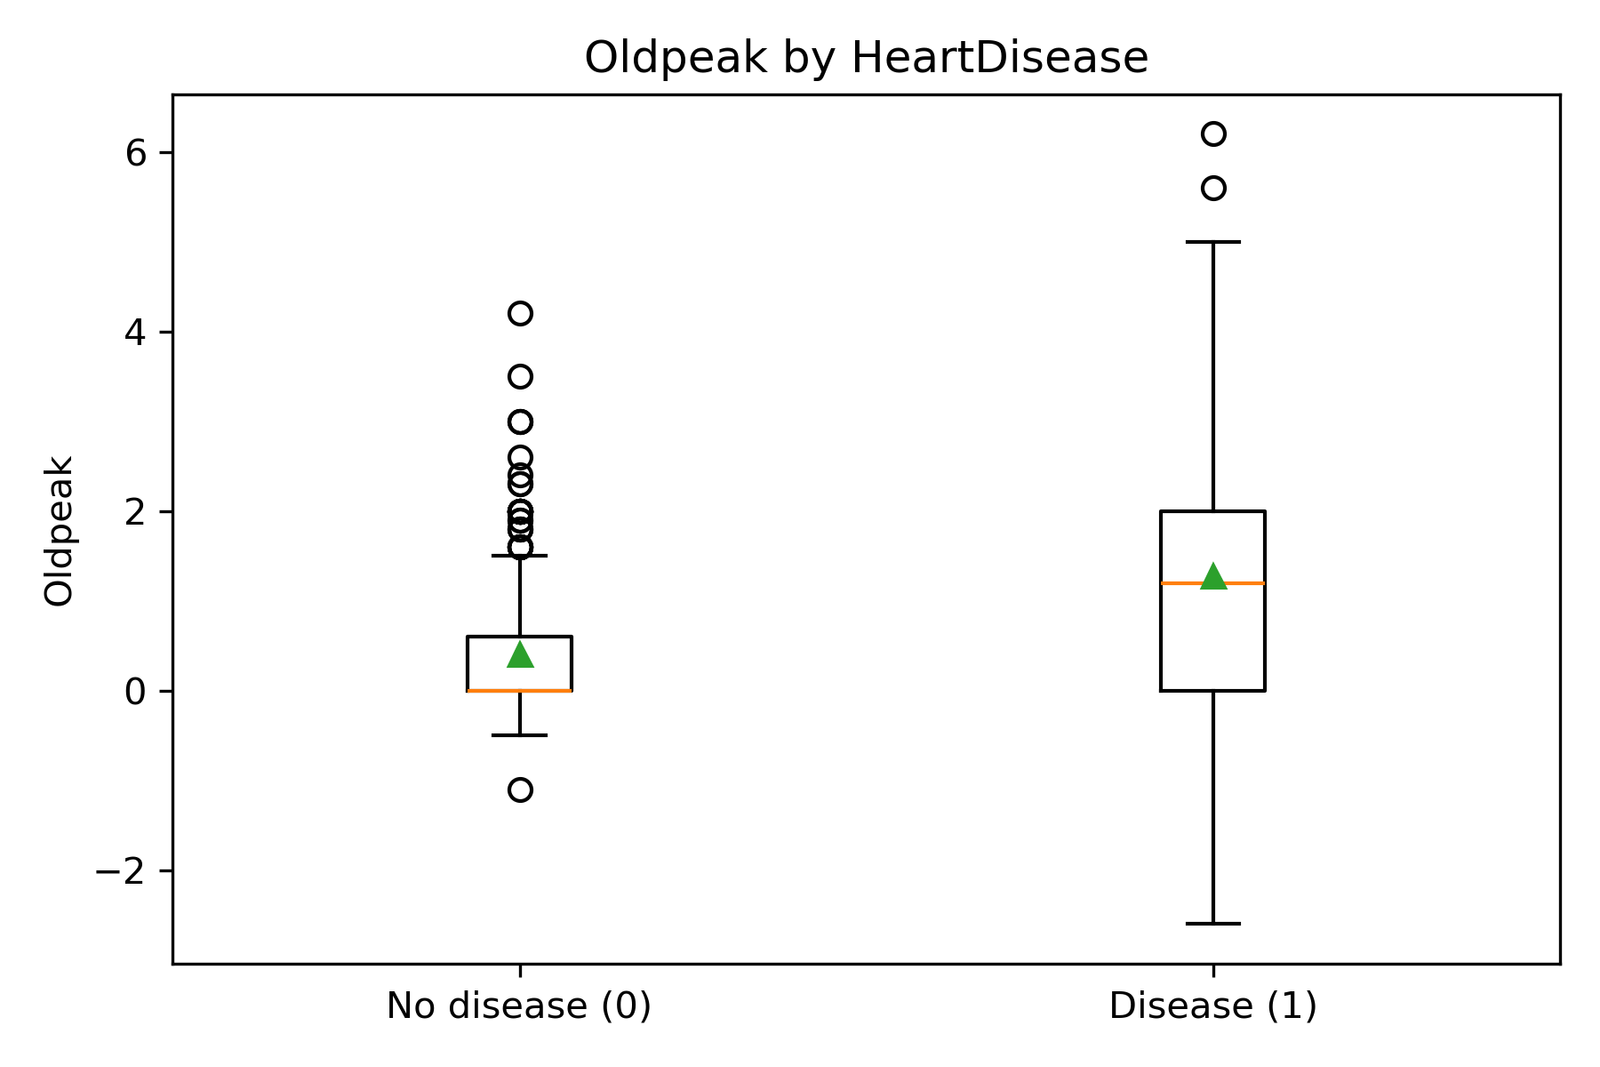
The box plot titled “Oldpeak by HeartDisease” compares two patient groups:
-
No Disease (0) – Individuals without heart disease
-
Disease (1) – Individuals diagnosed with heart disease
Each box displays the median (orange line), interquartile range (box height), and outliers (circles).
The green triangles represent the mean Oldpeak values in each group.
3. Key Insights
-
Higher Oldpeak values are strongly associated with heart disease.
Patients diagnosed with heart disease exhibit higher median and mean ST depression, indicating reduced oxygen supply during exertion. -
Healthy individuals generally cluster around low or near-zero Oldpeak levels, reflecting normal ECG recovery after exercise.
-
The presence of outliers in both groups suggests variability in individual responses, emphasizing the need for multi-variable assessment rather than relying on a single metric.
-
The overlap between the two boxes indicates that Oldpeak should be used alongside other predictors like Exercise Angina and ST Slope for accurate diagnosis.
4. Clinical and Policy Implications
From a clinical perspective:
-
Elevated Oldpeak values signal potential myocardial stress and ischemic heart disease risk, warranting further evaluation via stress tests or imaging.
-
Physicians can use this measure to prioritize high-risk patients for lifestyle modification or medication.
From a public health and policy perspective:
-
Ministries of Health should promote accessible ECG-based screening programs, especially in rural or low-income settings.
-
Health insurance schemes can incentivize preventive diagnostics to reduce late-stage cardiac care costs.
-
Integration of Oldpeak analytics into digital health dashboards can enhance data-driven policy design and epidemiological tracking.
5. Analytical Notes
The analysis is based on Kaggle’s open cardiovascular dataset, processed using Python (pandas, matplotlib, seaborn).
This boxplot highlights the importance of quantitative ECG features in understanding the prevalence of heart disease and supporting precision medicine.
6. Acknowledgement
This post is part of the DatalytIQs Academy Health Analytics Series, which applies data science to decode clinical insights for education, policy, and research.
Author: Collins Odhiambo Owino
Institution: DatalytIQs Academy — Bridging Data, Mathematics, Economics, and Health.
7. Policy Reflection
This visualization illustrates how a single ECG feature can provide powerful insights into national health challenges.
By embedding such analytics into public health infrastructure, we can transition from reactive care to predictive prevention, aligning data analytics with Sustainable Development Goal 3 (Good Health and Well-being).
Leave a Reply
You must be logged in to post a comment.