Cardiovascular disease affects both men and women, but not equally. Biological, hormonal, and behavioral differences shape the way each sex experiences and responds to heart conditions.
This post examines the relationship between Sex and Heart Disease, using data-driven visualization to highlight disparities in prevalence and risk.
2. Understanding the Visualization

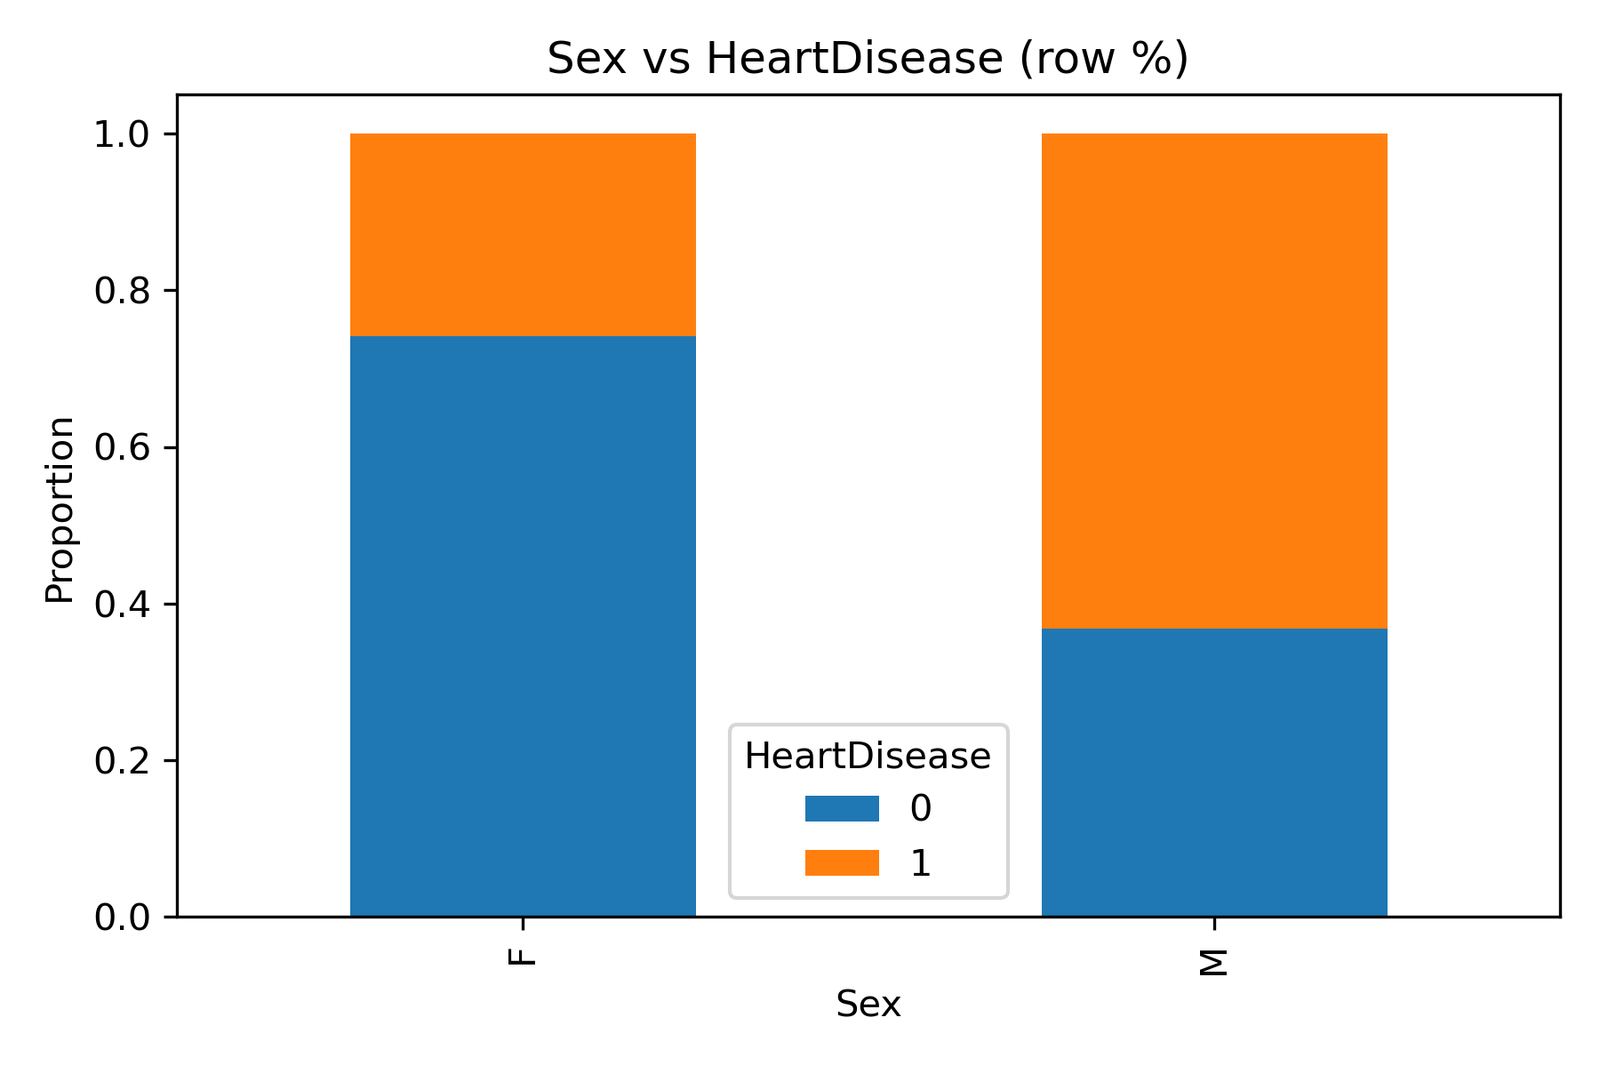
The chart titled “Sex vs Heart Disease (row %)” compares the proportion of individuals diagnosed with heart disease (HeartDisease = 1) and those without it (HeartDisease = 0) across two groups:
-
F (Female)
-
M (Male)
The blue bars represent individuals without heart disease, while the orange bars represent those with the condition. Each bar’s height is proportional within its sex category.
3. Key Insights
-
Men (M) show a higher prevalence of heart disease compared to women, with over 60% of male respondents in the affected category.
-
Women (F) display a lower occurrence of heart disease, likely influenced by hormonal protection (estrogen) and differences in lifestyle factors.
-
However, when women develop heart disease, their symptoms tend to be less typical, such as fatigue or nausea instead of classic chest pain, leading to potential underdiagnosis or delayed treatment.
-
The visualization highlights that sex-specific diagnostic and preventive strategies are crucial to equitable healthcare.
4. Policy and Public Health Implications
The gender gap revealed here has far-reaching implications:
-
Health ministries should implement gender-responsive cardiovascular programs, emphasizing awareness and screening tailored to women’s symptom patterns.
-
Workplace wellness programs should address men’s higher risk by promoting regular health checkups and stress management.
-
National data systems must disaggregate health records by sex to guide evidence-based resource allocation and policy formulation.
In summary, this analysis confirms that gender is not just a demographic variable; it’s a determinant of heart health outcomes.
5. Analytical Context
This visualization was generated from Kaggle’s open cardiovascular dataset, analyzed with Python libraries (pandas, matplotlib, and seaborn).
Each proportion represents normalized row percentages, offering a clear comparison between female and male patterns in heart disease prevalence.
6. About DatalytIQs Academy
DatalytIQs Academy integrates analytical insights across Mathematics, Economics, and Finance, expanding into Health Analytics to empower evidence-based decision-making.
Through our visual analytics series, we demonstrate how data reveals hidden patterns that can shape policy, practice, and prevention.
7. Author’s Note
Written by Collins Odhiambo Owino, founder of DatalytIQs Academy, dedicated to advancing analytics education and translating data into action for sustainable health and development outcomes.
Leave a Reply
You must be logged in to post a comment.