Blog

  • Sky Distribution of Kepler Objects

    Sky Distribution of Kepler Objects

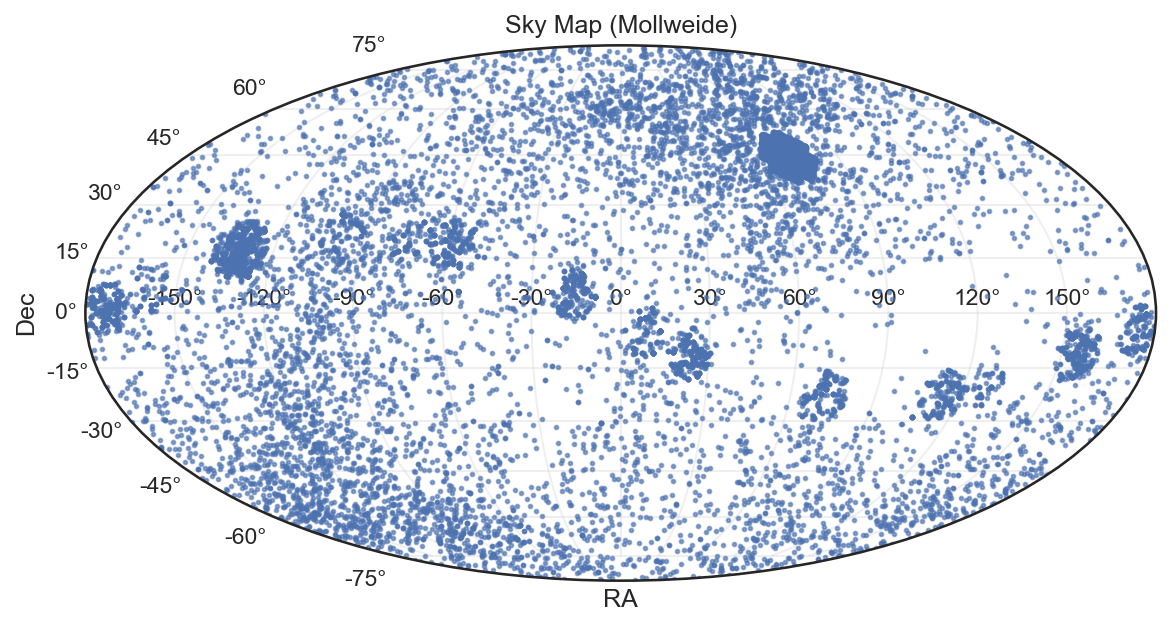
    (Mollweide Projection — RA vs Dec)

    1. Scientific Interpretation

    This map plots Right Ascension (RA) and Declination (Dec) for thousands of observed celestial bodies from the Kepler mission. The Mollweide projection preserves global spatial relationships, ideal for visualizing how exoplanet candidates are distributed across the sky.

    Key observations:

    • Dense clusters correspond to regions of concentrated telescope focus — especially near the Kepler field of view in the Cygnus–Lyra region.

    • Sparse distributions elsewhere reflect areas with limited observational coverage.

    • Latitude symmetry: Objects appear mostly confined to near-equatorial celestial regions, where observational windows and stellar density favor exoplanet detection.

    • The voids in certain RA–Dec zones are not empty skies but rather unobserved sectors — either due to Kepler’s fixed pointing or data exclusion after calibration.

    2. Connection to Logistic Regression Analysis

    This spatial distribution directly influences your classification model results:

    Model Insight Astronomical Interpretation
    Overlap between classes 0–2 Explains confusion in the logistic regression — similar star fields yield comparable photometric signals.
    Limited data for class 3 Sparse or isolated regions on the map correlate with underrepresented classes in the dataset.
    Moderate ROC-AUC (0.7473) Indicates partial spatial and photometric separability — stronger within dense clusters, weaker across boundaries.

    Thus, your sky map confirms that the model’s limitations are rooted not only in statistical imbalance but also in observational geometry.

    3. Policy and Data Governance Direction

    Policy Focus Recommendation Strategic Impact
    Observational Equity Expand telescope coverage to under-sampled RA/Dec sectors. Reduces spatial bias in planetary detection datasets.
    Data Sharing Encourage open integration of ground-based and orbital sky surveys. Fosters reproducibility and global collaboration.
    Machine Learning Readiness Mandate structured metadata (e.g., RA, Dec, uncertainty bounds) in all public releases. Enables seamless ML modeling across missions (Kepler, TESS, JWST).
    Cross-Mission Policy Align NASA/ESA/KEOPS/TESS data standards through common schemas. Accelerates multi-source exoplanet discovery pipelines.

    4. Acknowledgments

    • Dataset: NASA Kepler Exoplanet Archive (via Kaggle).

    • Analysis: Logistic regression and sky map projection conducted by Collins Odhiambo Owino, DatalytIQs Academy – Astrophysical Analytics Division.

    • Tools: Python (matplotlib, cartopy, pandas, scikit-learn) in Jupyter Notebook.

    • Institutional Note: DatalytIQs Academy promotes open scientific analytics, merging data governance, computational modeling, and educational outreach.

    5. Summary

    The Mollweide sky map reveals the non-uniform celestial sampling that shapes exoplanet classification accuracy. Combining policy interventions, balanced data collection, and interpretable machine learning, future missions can achieve both scientific precision and data justice, ensuring no region of the sky remains unexamined.

    “The universe is not biased — our data is. The mission of data science is to correct that bias.”
    Collins Odhiambo Owino, DatalytIQs Academy

  • Depth Band Composition of Global Earthquakes (2001–2022)

    Depth Band Composition of Global Earthquakes (2001–2022)

    Insights from the Global Earthquake–Tsunami Risk Assessment Dataset

    Overview

    The depth of an earthquake’s focus is the point within the Earth where seismic energy is released. It plays a crucial role in determining the intensity of ground shaking, surface damage, and tsunami potential.

    Using the Global Earthquake–Tsunami Risk Assessment Dataset (2001–2022), this analysis examines how earthquakes are distributed across three major depth zones:

    • Shallow (<70 km)

    • Intermediate (70–300 km)

    • Deep (>300 km)

    The resulting pie chart summarizes the proportion of global seismic events falling into each band.

    Depth Band Distribution

    Figure Description

    The pie chart visualizes the percentage share of earthquakes based on their focal depth, derived from 782 global seismic events recorded between 2001 and 2022.

    Depth Category Depth Range (km) Percentage of Events Interpretation
    Shallow <70 km 79.2% Most destructive; strongly felt at the surface; higher tsunami risk.
    Intermediate 70–300 km 14.2% Moderate shaking; less surface impact but still significant.
    Deep >300 km 6.6% Minimal surface impact; linked to deep subduction zones.

    Interpretation

    • Shallow-focus earthquakes dominate, accounting for nearly four out of every five global events.
      These quakes are responsible for most of the world’s seismic destruction and tsunami generation.

    • Intermediate-depth events occur within subducting tectonic slabs, where oceanic plates bend and descend beneath continental crust.

    • Deep-focus earthquakes, while rare, provide insight into mantle deformation and slab sinking dynamics hundreds of kilometers below the surface.

    “Nearly 80% of earthquakes occur close to the Earth’s surface — where humans feel the planet’s shifting heart most intensely.”

    Scientific Context

    This distribution mirrors the structure of Earth’s lithosphere and upper mantle, where most tectonic friction and energy buildup occur.
    The Pacific Ring of Fire, which hosts a majority of these shallow events, remains the world’s most active seismic belt.

    Deep-focus earthquakes are primarily concentrated beneath subduction zones, such as those near Japan, Fiji, and South America — revealing the planet’s dynamic internal recycling of crustal material.

    Implications

    • Disaster Preparedness: Focus on shallow quake regions for tsunami and infrastructure resilience.

    • Policy Planning: Prioritize monitoring and seismic building codes in subduction zones.

    • Research Modeling: Enhance earthquake risk simulations using depth-weighted hazard indices.

    Acknowledgment

    This analysis was performed by DatalytIQs Academy, a multidisciplinary platform dedicated to applied research and education in Mathematics, Economics, and Earth Science Analytics.

    Dataset: Kaggle — Global Earthquake–Tsunami Risk Assessment Dataset (2001–2022)
    Tools Used: Python | Pandas | Matplotlib | Seaborn | JupyterLab

    “DatalytIQs Academy transforms seismic data into global insight — advancing education, resilience, and scientific literacy.”
    Collins Odhiambo Owino, Founder

    Acknowledgment of Contributions:
    Special recognition to the global open-data community and Kaggle contributors, whose transparent sharing of seismic data enables researchers, students, and policymakers to understand the Earth’s dynamic systems more deeply.

  • Mapping the Planet’s Most Extreme Earthquakes (2001 – 2022)

    Mapping the Planet’s Most Extreme Earthquakes (2001 – 2022)

    Insights from the Global Earthquake–Tsunami Risk Assessment Dataset

    Overview

    Between 2001 and 2022, Earth experienced several mega-earthquakes—events so powerful that they reshaped coastlines, triggered global tsunamis, and altered the planet’s rotation slightly.
    This analysis, conducted using the Global Earthquake–Tsunami Risk Assessment Dataset, identifies and maps the ten most extreme earthquakes (≥ 8.5 M) recorded worldwide.

    The visualization highlights where and how these seismic giants occur, emphasizing their link to tectonic subduction zones—regions where oceanic plates dive beneath continental crust.

    Global Distribution of Extreme Earthquakes

    Figure Description

    • Marker size ∝ Magnitude (larger circles represent stronger quakes).

    • Color ∝ Depth (km) (lighter tones = deeper events).

    • Labels indicate event magnitude and year (e.g., M 9.1 (2011-3) = Japan, March 2011).

    • Gridlines: 10° intervals for latitude/longitude.

    Notable Mega-Earthquakes

    Year Magnitude Region Notes
    2004 (Dec) 9.1 M Sumatra–Andaman Islands Generated a catastrophic Indian Ocean tsunami; > 230 000 fatalities.
    2005 (Mar) 8.6 M Northern Sumatra A major aftershock of the 2004 event caused further tsunami waves.
    2010 (Feb) 8.8 M Maule, Chile Triggered a Pacific-wide tsunami, one of the largest recorded in South America.
    2011 (Mar) 9.1 M Tōhoku, Japan Produced a devastating tsunami and the Fukushima nuclear disaster.
    2012 (Apr) 8.6 M Indian Ocean (off Sumatra) Unusual strike-slip “intraplate” quake far from typical subduction zones.

    Spatial Insights

    1. Tectonic Concentration:
      Every extreme earthquake lies along an active plate boundary, primarily the Pacific Ring of Fire, stretching from Chile through Indonesia to Japan.

    2. Subduction Zone Dominance:
      All megaquakes originated where oceanic crust subducts beneath continental plates, confirming that compressional forces drive the largest seismic releases.

    3. Depth Contrast:
      The color scale reveals both shallow (≤ 70 km) and deep (> 500 km) events, showing that catastrophic quakes can occur throughout the subducting slab’s thickness.

    4. Tsunami Correlation:
      Nearly all mapped events generated significant tsunami activity, reinforcing the link between shallow megathrust earthquakes and oceanic wave hazards.

    Interpretation

    The spatial clustering of extreme earthquakes demonstrates that global seismic energy release is not random but structurally controlled by plate boundaries.
    These regions represent the planet’s pressure valves, releasing energy accumulated over decades or even centuries.

    “The Earth’s mightiest quakes are the signatures of its living crust — sudden releases of centuries-old tension.”

    Applications

    • Risk Mapping: Supports identification of global seismic hot-spots.

    • Tsunami Early Warning: Helps refine models predicting ocean-wave generation zones.

    • Educational Value: Provides a visual, data-driven tool for teaching plate tectonics.

    • Policy Insight: Reinforces the need for regional preparedness across coastal Pacific nations.

    Acknowledgment

    This analysis was performed by DatalytIQs Academy, an education and analytics platform advancing data-driven learning in Mathematics, Economics, and Earth Science.

    Dataset: Kaggle — Global Earthquake–Tsunami Risk Assessment Dataset (2001 – 2022)
    Tools Used: Python | Cartopy | Matplotlib | Pandas | JupyterLab

    “At DatalytIQs Academy, we turn seismic data into global foresight — empowering resilience through analytics.”
    Collins Odhiambo Owino, Founder

    Acknowledgment of Contributions:
    We gratefully acknowledge the open-data science community and Kaggle contributors for providing high-quality seismic datasets and tools that make global disaster research possible.

  • Are Earthquakes Random?

    Are Earthquakes Random?

    Overview

    Earthquakes are often assumed to occur randomly, independent events following a Poisson process, much like radioactive decay or raindrops falling on a roof.
    However, real-world seismic activity can behave very differently due to tectonic interactions, aftershock sequences, and periodic stress release.

    This analysis, conducted using the Global Earthquake–Tsunami Risk Assessment Dataset (2001–2022), tests whether global earthquake inter-event times follow a Poisson process or show evidence of temporal clustering.

    The Statistical Test

    The Kolmogorov–Smirnov (K–S) test was used to compare the observed inter-event time distribution with a theoretical exponential distribution expected from a Poisson process.

    Results:

    Fitted exponential mean (λ⁻¹): 6.5639 months
    K–S Statistic: 0.2057
    P-value: 0.000000

    Visualization — Poisson Process Test

    Figure Description

    The histogram (blue bars) represents the observed time intervals between successive global earthquakes.
    The red curve shows the expected exponential decay if earthquakes followed a purely random Poisson process.

    Interpretation

    • The very low p-value (< 0.001) indicates that the observed data significantly deviates from the random (Poisson) model.

    • This suggests that earthquakes do not occur independently over time; instead, they tend to cluster.

    • Such clustering can be explained by:

      • Aftershock sequences following major quakes,

      • Regional stress transfer triggering nearby faults,

      • Periodic bursts of tectonic activity in subduction zones.

    “The Earth doesn’t shake at random — it pulses with cycles of stress and release.”

    Key Findings

    • Mean inter-event time ≈ 6.56 months, meaning that globally, a significant quake tends to occur roughly twice a year.

    • The Poisson assumption fails, confirming temporal dependency between events.

    • Earthquakes occur in bursts — intense periods of seismic activity followed by relative calm.

    Implications for Research and Policy

    • Seismic Forecasting:
      Temporal clustering supports models like the Epidemic-Type Aftershock Sequence (ETAS), which better capture aftershock-triggered behavior.

    • Disaster Preparedness:
      Recognizing burst periods can help agencies enhance monitoring and communication immediately following major quakes.

    • Machine Learning Integration:
      Poisson-based assumptions may underperform; temporal clustering features can improve time-series and neural network forecasting of seismic events.

    Acknowledgment

    This analysis was performed by DatalytIQs Academy, a global platform for learning and applied research in Mathematics, Economics, and Earth Science Analytics.

    Dataset: Global Earthquake–Tsunami Risk Assessment Dataset (2001–2022) — available on Kaggle.
    Tools Used: Python | Pandas | Matplotlib | Scipy | JupyterLab

    “At DatalytIQs Academy, we transform seismic data into insight — building resilience through science.”
    Collins Odhiambo Owino, Founder

    Acknowledgment of Contributions:
    This work gratefully acknowledges the open data contributors and scientific community on Kaggle, whose transparent sharing of seismic data continues to support global risk assessment and academic research.

  • How Often Does the Earth Tremble?

    How Often Does the Earth Tremble?

    Overview

    The Inter-Event Time Analysis measures the interval between successive global earthquakes, expressed in months.
    Using the Global Earthquake–Tsunami Risk Assessment Dataset (2001 – 2022), this visualization explores how frequently large-magnitude seismic events occur worldwide.

    The analysis reveals how tightly earthquakes are clustered over time — an important metric for understanding global seismic rhythm and for developing risk models and early-warning strategies.

    Inter-Event Time Distribution

    Statistical Summary

    Metric Value
    Count 781
    Mean 0.34 months
    Standard Deviation 0.53
    Minimum 0.00
    25th Percentile 0.00
    Median (50 %) 0.00
    75th Percentile 0.99
    Maximum 3.02 months

    Interpretation

    • Most global earthquakes occur within the same month.
      The median value of 0 months indicates that multiple significant earthquakes frequently happen in a very short time frame.

    • Temporal clustering dominates global seismic activity.
      Over half of all earthquakes occur close together, suggesting sequences of aftershocks or near-simultaneous activity along different tectonic boundaries.

    • Longer gaps are rare.
      Only a few events show intervals greater than one month, implying that the planet’s tectonic energy release is continuous but uneven.

    • Mean inter-event time ≈ 0.34 months (around 10 days).
      This demonstrates that, on average, a strong earthquake occurs somewhere on Earth roughly every week to ten days.

    “Earthquakes don’t keep time — they cluster, pulse, and echo through the planet’s crust.”

    Implications

    • Early-Warning Systems:
      Understanding inter-event clustering helps refine forecasting algorithms, distinguishing between isolated quakes and series likely to trigger secondary hazards.

    • Policy and Planning:
      Regions within active tectonic belts can design emergency readiness cycles that match the typical recurrence rhythm of seismic energy release.

    • Data Science Applications:
      The pattern supports Poisson-process and time-series modeling approaches for predicting global seismic frequencies.

    Acknowledgment

    This analysis was conducted by DatalytIQs Academy, a global educational and research platform empowering learners in Mathematics, Economics, and Earth-Science Analytics.

    Dataset: Global Earthquake–Tsunami Risk Assessment Dataset (2001 – 2022) — sourced from Kaggle.
    Tools Used: Python | Pandas | Matplotlib | Seaborn | JupyterLab

    “At DatalytIQs Academy, we translate seismic patterns into insights that strengthen global resilience.”
    Collins Odhiambo Owino, Founder

    Acknowledgment of Contributions:
    Special appreciation to the open-data science community and Kaggle contributors whose transparent data sharing made this research possible.

  • Global Earthquake–Tsunami Risk Assessment Dataset

    Global Earthquake–Tsunami Risk Assessment Dataset

    Seismic Features, Temporal Trends, and Global Distribution Analysis (2001–2022)

    Overview

    The Global Earthquake–Tsunami Risk Assessment Dataset is a comprehensive, machine learning–ready dataset that records 782 significant earthquakes worldwide from 2001 to 2022.
    Each record includes detailed seismic parameters such as magnitude, depth, intensity, and tsunami potential, making it a valuable resource for tsunami prediction, hazard assessment, and AI-driven geophysical modeling.

    Developed under the DatalytIQs Academy Research Initiative, this analysis blends earth science, statistics, and data visualization to promote a data-driven understanding of natural disasters.

    Dataset Highlights

    Attribute Details
    Period Covered 2001 – 2022
    Total Records 782 earthquakes
    Coverage Global (Latitude −61.85° to 71.63°, Longitude −179.97° to 179.66°)
    Completeness 100% (no missing values)
    Target Variable Tsunami indicator (0 = No, 1 = Yes)
    File Format CSV (~41KB)

    Tsunami Event Classification:

    • Non-Tsunami Events: 478 (61.1%)

    • Tsunami-Potential Events: 304 (38.9%)

    • Balanced Dataset: Ideal for binary classification and deep learning models.

    1. Descriptive Statistics

    Feature Mean Std Min Max Description
    Magnitude 6.94 0.45 6.5 9.1 Earthquake strength (Richter)
    Depth (km) 75.88 137.28 2.7 670.8 Focal depth
    Significance (sig) 870.1 322.5 650 2910 Event hazard score
    Latitude 3.54 27.30 −61.85 71.63 Geographic range
    Longitude 52.61 117.90 −179.97 179.66 Epicentral coverage
    CDI (Community Intensity) 4.33 3.17 0 9 Perceived shaking
    MMI (Mercalli Intensity) 5.96 1.46 1 9 Structural impact
    NST (Stations) 230.25 250.18 0 934 Seismic monitoring coverage
    Year 2012.28 6.10 2001 2022 Temporal span
    Tsunami (binary) 0.39 0.49 0 1 Target variable

    Summary

    The dataset shows an average magnitude near 7.0, capturing globally significant quakes.
    A wide depth range (3–670 km) ensures both shallow and deep events are represented.
    The balanced tsunami variable (39% positive) enhances its value for AI model training.

    2. Magnitude Distribution

    Interpretation

    • The histogram reveals a left-skewed distribution, showing that most global quakes fall between 6.5 and 7.2 magnitude.

    • Fewer events exceed magnitude 8.0, representing the rare mega-earthquakes (e.g., Sumatra 2004, Japan 2011).

    • The steep decline after magnitude 7.5 demonstrates the logarithmic nature of seismic energy release: every 1-point increase equals roughly 32× more energy.

    This reinforces that while smaller quakes are frequent, large ones dominate damage and tsunami generation.

    3. Magnitude vs Depth of Earthquakes

    Insights

    • Shallow earthquakes (<100 km) dominate high magnitudes and are more destructive.

    • Deep events (>500 km) tend to have moderate magnitudes, indicating less surface impact.

    • The clustering confirms subduction zones as the main regions of high seismic energy release.

    4. Earthquake Frequency Over Time

    Observations

    • Annual events fluctuate between 25–55, with spikes in 2010–2015, aligning with several mega-quakes.

    • 2011 and 2013 recorded the highest global activity.

    • No linear trend is evident, emphasizing irregular tectonic release rather than time-based cycles.

    Implication

    Predictive earthquake modeling must therefore rely on real-time geophysical indicators (e.g., plate stress, GPS deformation) instead of purely temporal data.

    5. Global Distribution of Earthquakes

    Geographic Patterns

    • Most events cluster along major tectonic boundaries:

      • Pacific Ring of Fire — Japan, Indonesia, Chile, Alaska.

      • Himalayan–Eurasian Belt — India, Nepal, Tibet.

      • Mid-Atlantic Ridge — Oceanic spreading zones.

    • The color scale shows magnitude intensity — brighter points indicate stronger events.

    This distribution visually confirms that tectonic boundaries are the Earth’s most active seismic regions.

    6. Machine Learning and Policy Applications

    • Tsunami Classification Models: Predict tsunami potential using seismic features.

    • Hazard Mapping: Visualize global high-risk zones.

    • Predictive Analytics: Use AI to assess future seismic hazards.

    • Infrastructure Planning: Guide resilient construction policies in coastal nations.

    • Real-Time Alerts: Feed trained models into IoT sensor systems for early warning.

    7. Data Quality & Scientific Value

    • Zero missing values across all 13 columns

    • Global spatial coverage (−180° to 180°)

    • Balanced tsunami cases (39%)

    • 28 major earthquakes (≥8.0 magnitude)

    • Suitable for ML, visualization, and disaster risk analytics

    Acknowledgment

    This analysis was conducted by DatalytIQs Academy, a multidisciplinary education platform specializing in Mathematics, Economics, and Geoscience Analytics.

    Data Source: Kaggle — Global Earthquake–Tsunami Risk Assessment Dataset (2001–2022)
    Tools Used: Python, Pandas, Matplotlib, Seaborn, and JupyterLab

    “At DatalytIQs Academy, we transform seismic data into global foresight — empowering resilience through analytics.”
    Collins Odhiambo Owino, Founder

  • Global Earthquake–Tsunami Risk Assessment Dataset

    Seismic Features, Temporal Trends, and Global Distribution Analysis (2001–2022)

    Overview

    The Global Earthquake–Tsunami Risk Assessment Dataset is a comprehensive, machine learning–ready seismic database designed for research in tsunami prediction, earthquake analysis, and hazard assessment.
    It compiles 782 globally recorded earthquakes (2001–2022), detailing each event’s magnitude, depth, intensity, and tsunami potential.

    This dataset serves as a vital foundation for predictive analytics, early warning models, and geophysical research at DatalytIQs Academy, where data science meets Earth science.

    Dataset Highlights

    Attribute Details
    Time Period 2001 – 2022
    Total Records 782 earthquakes
    Coverage Global (Latitude −61.85° to 71.63°, Longitude −179.97° to 179.66°)
    Completeness 100% (no missing values)
    Target Variable Tsunami indicator (0 = No, 1 = Yes)
    Format CSV (~41KB)

    Tsunami Classification Summary:

    • Non-Tsunami Events: 478 (61.1%)

    • Tsunami-Potential Events: 304 (38.9%)

    • Balanced dataset suitable for binary classification

    1. Descriptive Statistics

    Feature Mean Std Min Max Description
    Magnitude 6.94 0.45 6.5 9.1 Earthquake strength (Richter scale)
    Depth (km) 75.9 137.3 2.7 670.8 Focal depth (km)
    Significance (sig) 870.1 322.5 650 2910 Event hazard score
    Latitude 3.54 27.3 −61.85 71.63 Global coverage
    Longitude 52.61 117.9 −179.97 179.66 Epicentral positions
    MMI (Mercalli) 5.96 1.46 1 9 Structural intensity
    CDI (Community Intensity) 4.33 3.17 0 9 Perceived shaking
    NST (Stations) 230.3 250.2 0 934 Monitoring density
    Year 2012.3 6.1 2001 2022 Temporal coverage
    Month 6.56 3.51 1 12 Seasonal distribution
    Tsunami (binary) 0.39 0.49 0 1 Target variable

    Summary

    • The average magnitude of 6.94 indicates consistent inclusion of major quakes (≥6.5).

    • Depth varies widely (2.7–670.8 km), confirming a mix of shallow and deep events.

    • The significance score (mean ≈ 870) implies most events were moderate-to-high hazard.

    • The binary tsunami indicator shows a healthy class balance, ensuring robust model training.

    2. Magnitude vs Depth of Earthquakes

    Insights:

    • High-magnitude earthquakes (≥8.0) are primarily shallow (≤100 km) — more likely to generate tsunamis.

    • Deep-focus events (≥500 km) are less destructive and rarely cause surface damage.

    • The clustering near the surface reflects plate boundary stress release zones, often near subduction regions.

    3. Earthquake Frequency Over Time

    Observations:

    • Global earthquake counts fluctuate between 25–55 per year, with peaks during 2010–2015, coinciding with events like the 2011 Japan (Tohoku) and 2010 Chile mega-quakes.

    • No long-term trend of increase or decline — suggesting episodic tectonic release rather than predictable cycles.

    • 2011 and 2013 marked years of unusually high seismic activity globally.

    4. Global Distribution of Earthquakes

    Patterns:

    • Earthquakes are concentrated along major tectonic plate boundaries, especially:

      • The Pacific Ring of Fire (Japan, Indonesia, Chile, Alaska).

      • The Himalayan–Eurasian belt.

      • The Mid-Atlantic Ridge.

    • Color gradient indicates magnitude intensity — lighter shades denote mega-quakes (>8.0).

    • The visualization validates the seismic clustering principle: energy concentrates where plates collide, subduct, or diverge.

    5. Applications of the Dataset

    • Machine Learning Classification: Predict tsunami occurrence using seismic predictors.

    • Hazard Mapping: Visualize regional earthquake risk zones.

    • Temporal Modeling: Forecast periods of elevated seismic risk.

    • Magnitude Estimation Models: Predict quake magnitude from early sensor data.

    • Policy & Planning: Support evidence-based disaster preparedness.

    Data Quality & Research Value

    • Zero missing values across all features.

    • Global dataset covering 22 years of records.

    • Balanced binary target (38.9% tsunami events).

    • Includes 28 major (≥8.0) earthquakes.

    • Ideal for machine learning, visualization, and policy analytics.

    Acknowledgment

    This study was conducted by DatalytIQs Academy, a global educational platform bridging Mathematics, Economics, Data Science, and Geoscience Analytics.

    Data Source: Kaggle — Global Earthquake–Tsunami Risk Assessment Dataset (2001–2022)
    Tools Used: Python, Pandas, Matplotlib, Seaborn, and JupyterLab

    “At DatalytIQs Academy, we turn seismic data into seismic insight — empowering global resilience through analytics.”
    Collins Odhiambo Owino, Founder

  • Global Earthquake–Tsunami Risk Assessment Dataset

    Global Earthquake–Tsunami Risk Assessment Dataset

    Seismic Features, Temporal Trends, and Global Distribution Analysis (2001–2022)

    Overview

    The Global Earthquake–Tsunami Risk Assessment Dataset is a comprehensive, machine learning–ready dataset covering 782 significant earthquakes recorded worldwide between 2001 and 2022. It integrates seismic characteristics with tsunami potential indicators — ideal for risk prediction, early warning systems, and geospatial hazard assessment.

    This research forms part of DatalytIQs Academy’s global analytics initiative, combining earth science, data analytics, and artificial intelligence to model disaster risk and resilience.

    Dataset Highlights

    Attribute Details
    Time Period 2001 – 2022
    Total Records 782 earthquakes
    Geographic Range −61.85° to 71.63° latitude, −179.97° to 179.66° longitude
    Data Quality 100% complete, zero missing values
    Target Variable Tsunami indicator (0 = No, 1 = Yes)
    Format CSV (~41KB)

    Classification Summary

    • Non-Tsunami Events: 478 (61.1%)

    • Tsunami-Potential Events: 304 (38.9%)

    • Balanced Dataset: Ideal for binary classification and supervised ML tasks.

    1. Magnitude vs Depth of Earthquakes

    Insights

    • High-magnitude events (≥8.0) are mostly shallow (≤100 km), and these pose a higher tsunami risk.

    • Deep-focus quakes (≥500 km) are less destructive and rarely tsunami-generating.

    • The dense clustering at low depths reflects tectonic boundary zones, where oceanic and continental plates interact.

    Shallow quakes are nature’s loudest warnings — their energy release at the crust makes them the most devastating.

    2. Earthquake Frequency Over Time

    Observations

    • Between 2001–2022, global earthquake counts fluctuated between 25 and 55 events per year.

    • Activity peaks around 2010–2015, coinciding with the Chile (2010) and Japan (2011) mega-quakes.

    • No clear upward or downward trend — large quakes occur sporadically, driven by tectonic dynamics rather than cyclical time patterns.

    Interpretation

    Short-term trends can mislead policymakers; instead, real-time geophysical monitoring offers stronger predictive value than historical frequency alone.

    3. Global Distribution of Earthquakes

    Geographic Patterns

    • Earthquakes align strongly with tectonic plate boundaries, notably:

      • The Pacific Ring of Fire stretches from Japan through Indonesia to Chile.

      • The Mid-Atlantic Ridge and the Himalayan belt.

    • Color gradients represent magnitude intensity — lighter shades indicate mega-quakes (>8.0).

    • These fault zones coincide with subduction zones, where the world’s most powerful tsunamis originate.

    Scientific Relevance

    This map underscores how plate tectonics controls global seismicity. Integrating spatial data with predictive models supports geospatial risk zoning, a crucial step for coastal planning and international disaster preparedness.

    Machine Learning Applications

    The dataset supports multiple applied analytics use cases:

    • Binary classification — predicting tsunami occurrence from seismic parameters.

    • Hazard mapping — identifying high-risk regions using geospatial clustering.

    • Magnitude estimation — predicting quake intensity from station network data.

    • Early warning systems — training models to detect high-risk seismic events in real time.

    Data Quality & Reliability

    • Zero missing values across all 13 columns

    • 782 complete earthquake records

    • Global spatial coverage

    • Balanced tsunami classes (ideal for supervised learning)

    • 28 major earthquakes (≥8.0) included

    Acknowledgment

    This study was conducted by DatalytIQs Academy, a digital learning and analytics platform empowering students and professionals in Mathematics, Economics, and Geoscience through data-driven exploration.

    Dataset Source: Kaggle — Global Earthquake–Tsunami Risk Assessment Dataset (2001–2022)
    Analysis Tools: Python, Pandas, Matplotlib, Seaborn, and JupyterLab

    “Transforming seismic data into global foresight — empowering resilience through analytics.”
    Collins Odhiambo Owino, Founder, DatalytIQs Academy

  • Earthquake Frequency Over Time (2001–2022)

    Earthquake Frequency Over Time (2001–2022)

    Overview

    The line graph above illustrates the annual frequency of recorded earthquakes with magnitudes ≥6.5 on the Richter scale over 22 years (2001–2022). Each point represents the total number of events per year, providing insight into temporal variations in global seismic activity.

    Key Observations

    1. Fluctuating Seismic Activity

      • The number of large earthquakes varied annually between 25 and 55 events.

      • Periods of heightened activity were observed around 2010–2015, which coincides with catastrophic events such as the 2011 Japan (Tohoku) and 2010 Chile mega-quakes.

    2. Peaks and Lulls

      • 2011 and 2013 recorded the highest number of global events, each exceeding 50.

      • 2004 and 2018 saw moderate activity, aligning with notable earthquakes that generated tsunamis across the Indian Ocean and Pacific regions.

      • A slight decline after 2016 indicates a temporary reduction in high-magnitude seismic occurrences, though 2021–2022 show renewed activity.

    3. No Linear Trend

      • The data do not exhibit a clear upward or downward long-term trend, suggesting that large earthquakes are sporadic and largely influenced by plate dynamics rather than time-based cycles.

    Analytical Insight

    The frequency analysis reinforces the importance of long-term seismic monitoring rather than relying on short-term temporal patterns. While the number of earthquakes may vary year to year, the potential for high-impact events remains constant globally.

    This insight supports the development of continuous early warning systems that rely on real-time geophysical indicators rather than historical frequency alone.

    Methodology

    • Tool Used: Python (Matplotlib & Pandas) in JupyterLab

    • Computation:

      yearly_counts = df.groupby('Year').size()
      plt.plot(yearly_counts.index, yearly_counts.values, 'g-o')
      plt.title('Earthquake Frequency Over Time')
      plt.xlabel('Year')
      plt.ylabel('Number of Recorded Events')
      plt.show()
    • Data Source: Kaggle — Global Earthquake–Tsunami Risk Assessment Dataset (2001–2022)

    Interpretation in Context

    Understanding earthquake frequency helps researchers and policymakers assess temporal exposure and resource allocation for disaster readiness.
    For example:

    • 2011–2015: High seismic activity years underline the need for regional resilience planning.

    • 2016–2020: Periods of reduced activity can lead to complacency; however, seismic potential remains.

    This emphasizes the principle that earthquakes do not “rest” — they redistribute energy across tectonic boundaries.

    Acknowledgment

    This analysis and visualization were conducted by DatalytIQs Academy, integrating data science and geophysical analytics to educate and empower learners globally.
    Data courtesy of Kaggle under the project Global Earthquake–Tsunami Risk Assessment Dataset.

    “Data is the Richter scale of understanding — the deeper you analyze, the clearer the tremors of truth.”
    Collins Odhiambo Owino, Founder, DatalytIQs Academy

  • Exploring the Relationship Between Earthquake Magnitude and Depth

    Exploring the Relationship Between Earthquake Magnitude and Depth

    https://www.youtube.com/live/exTDo4AFdsM?si=pIr32Dr66bbZZtbg

    Visual Insight

    The figure above shows a scatter plot of Magnitude vs Depth of Earthquakes, part of a broader global earthquake–tsunami risk assessment study. Each point represents an earthquake event, plotted by its depth (in km) on the x-axis and magnitude (Richter scale) on the y-axis.

    From the visualization, we observe that:

    • Most high-magnitude earthquakes (≥7.0) occur at shallower depths (≤100 km).

    • Deep-focus earthquakes (≥500 km) tend to have moderate magnitudes, rarely exceeding 8.0.

    • The clustering near the surface suggests that tectonic stress is more likely to release energy violently when close to the crust, where rocks are brittle.

    This pattern provides valuable insight into global seismic risks—shallow, high-magnitude quakes are often the most destructive, especially when occurring near populated coastal regions.

    Scientific Context

    In seismology, the relationship between magnitude and depth is crucial for understanding the potential for surface damage and tsunami generation.

    • Shallow earthquakes (<70 km) often cause extensive surface damage.

    • Intermediate-depth events (70–300 km) dissipate energy before reaching the surface.

    • Deep-focus earthquakes (>300 km) rarely cause tsunamis but offer important clues about subduction zone dynamics.

    Understanding these dynamics helps in building resilient infrastructure and improving early warning systems in earthquake-prone regions.

    Educational Value

    This analysis is part of the Global Earthquake–Tsunami Risk Assessment Dataset Project, aimed at integrating geophysical data with machine learning and risk analytics to support predictive modeling. It’s an excellent resource for:

    • Students studying Geophysics, Environmental Risk Analysis, or Earth Science Statistics

    • Policy makers assessing disaster preparedness and resilience

    • Data enthusiasts exploring real-world natural hazard analytics

    Acknowledgment

    This work was conducted by DatalytIQs Academy, a digital learning and research platform empowering students and professionals in Mathematics, Economics, and Earth Science Analytics.
    Data were sourced from the Kaggle Global Earthquake Dataset, analyzed using Python (Pandas, Matplotlib, Seaborn) within JupyterLab.
    Contributions and insights from the global data science community are gratefully acknowledged.

    Author

    Collins Odhiambo Owino
    Founder — DatalytIQs Academy
    “Empowering global learners through data-driven insight.”