

Source: Finance & Economics Dataset (2000–2025), processed in Python (JupyterLab, scikit-learn PCA analysis).
Interpretation
The chart illustrates the proportion of variance explained by each of the first three principal components derived from standardized macroeconomic and financial indicators:
| Component | Explained Variance (%) | Description |
|---|---|---|
| PC1 | 18.22% | Captures dominant patterns in financial market variables (daily price movements). |
| PC2 | 5.16% | Represents macroeconomic stress and fiscal–monetary linkages (inflation, debt, unemployment). |
| PC3 | 5.02% | Reflects global and sentiment-related dynamics (confidence, retail sales, capital flows). |
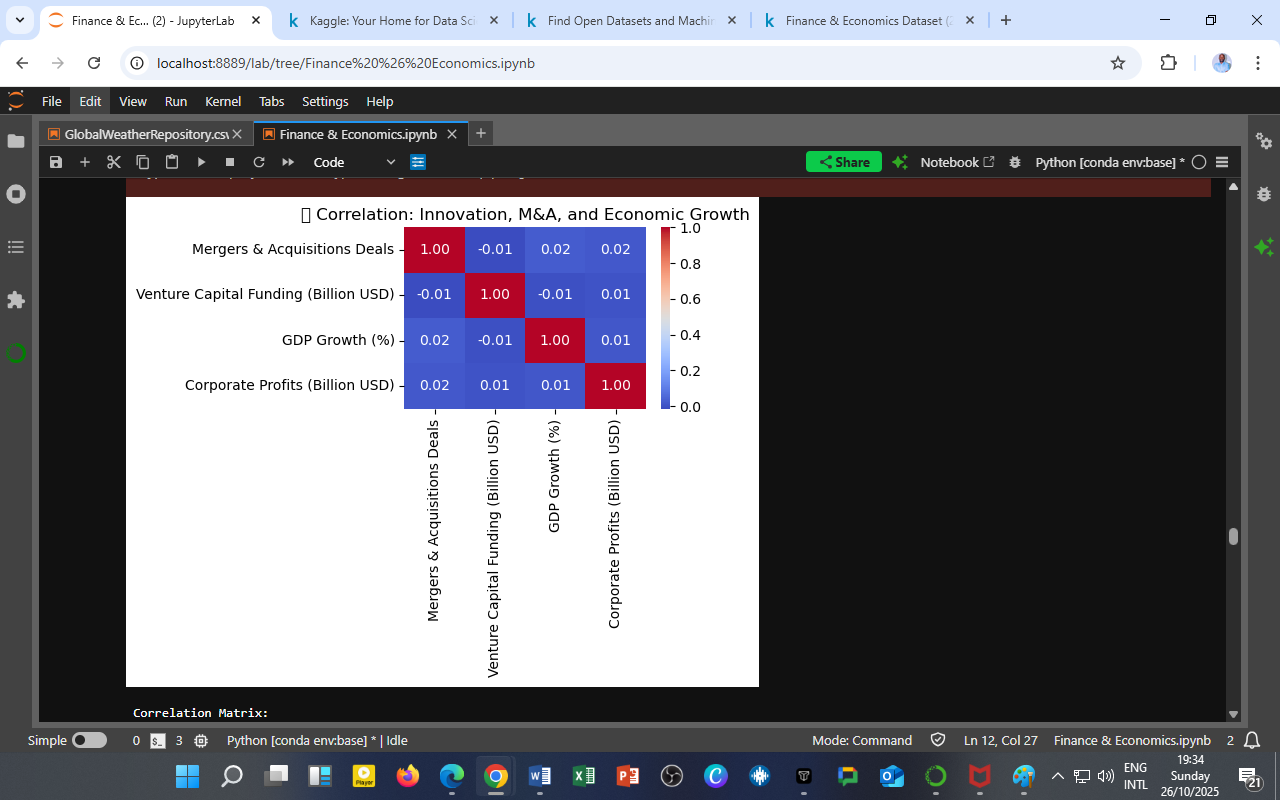
Together, the three components explain about 28.4% of the total variance, indicating that while economic data are highly multidimensional, these components capture nearly one-third of the system’s structural variability.
Analytical Insight
-
Sharp Drop After PC1:
The first principal component dominates due to the high-frequency volatility of financial markets, suggesting they account for most short-term movements. -
Relatively Flat PC2 and PC3:
The second and third components represent broader macroeconomic and behavioral cycles, whose influence unfolds over longer periods and across sectors. -
Dimensionality Reduction Benefit:
These three components can serve as latent factors in regression, forecasting, or clustering models — significantly reducing complexity while retaining key informational value.
Policy & Research Relevance
The PCA variance structure supports a three-pillar economic monitoring framework:
-
Market Sentiment Tracking (PC1)
-
Fiscal–Monetary Synchronization (PC2)
-
Confidence and Innovation Dynamics (PC3)
This tri-structure can guide both policy simulations and financial risk analytics within the DatalytIQs Academy Macro-Financial Dashboard environment.
Acknowledgment
Author: Collins Odhiambo Owino
Institution: DatalytIQs Academy — Department of Data Science & Economics
Software Environment: Python (pandas, scikit-learn, matplotlib), executed in JupyterLab
Dataset: Finance & Economics Dataset (2000–2025), Kaggle.
License: Educational Research License — DatalytIQs Open Repository Initiative


You must be logged in to post a comment.