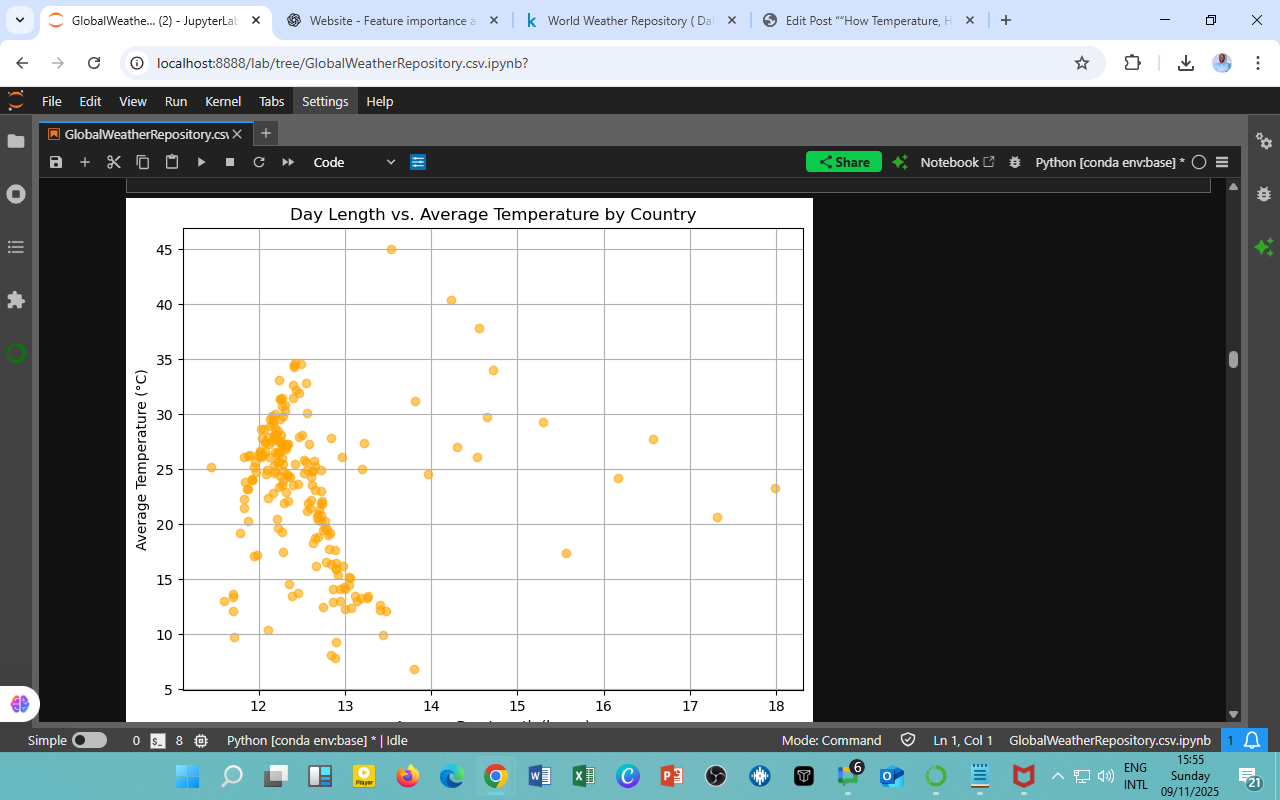
Sunlight is Earth’s most consistent source of energy, shaping temperature, seasons, and life itself. In this analysis from the Kaggle Global Daily Weather Dataset (2023–2024), we examine how day length (hours of daylight) relates to average temperature across world capitals. The scatter plot visualizes this dynamic, capturing how varying exposure to sunlight influences thermal patterns around the globe.
Understanding the Scatter Plot

-
X-axis: Average day length (in hours)
-
Y-axis: Average temperature (°C)
-
Each point represents a capital city’s daily weather conditions.
Most observations cluster around 12–13 daylight hours, reflecting Earth’s equatorial symmetry, where day and night lengths remain fairly constant year-round.
Interpretation and Key Insights
-
Equatorial Stability (12–13 hours, 25–35°C):
Countries near the Equator, such as Kenya, Indonesia, and Brazil, experience nearly equal day and night cycles.
Their consistent solar exposure results in high, stable temperatures throughout the year. -
Temperate Variability (13–17 hours):
As we move toward mid and high latitudes, day lengths stretch (up to 18 hours in summer), but average temperatures drop.
This reflects lower solar intensity per angle, even with extended daylight, a balance between duration and radiation strength. -
Outliers and Exceptions:
-
A few points around 45°C with ~13-hour days belong to arid zones (like Saudi Arabia), where cloud-free skies amplify heating.
-
Some cooler climates (below 15°C) maintain longer days, e.g., Nordic countries during summer, yet sunlight arrives at a low angle, reducing heat absorption.
-
Key Patterns and Scientific Context
| Observation | Interpretation | Climate Zone |
|---|---|---|
| Short day, high temperature | Equatorial zone with intense sun rays | Tropical |
| Long day, moderate temperature | High latitude with low solar angle | Temperate |
| Very long day, low temperature | Polar summer effect | Sub-Arctic |
This shows that day length alone doesn’t dictate warmth; it interacts with latitude, altitude, and cloud cover to shape local climates.
Practical Implications
-
Energy Planning: Solar energy projects can use day length data to forecast seasonal electricity production.
-
Agriculture: Farmers can align crop cycles with daylight availability to optimize growth and yield.
-
Tourism and Lifestyle: Understanding sunlight duration helps design sustainable tourism seasons and health advisories for UV exposure.
-
Climate Education: Demonstrates Earth’s axial tilt and its profound impact on global energy balance.
Acknowledgment
Dataset Source: Kaggle — Global Daily Weather Data (2023–2024)
Analysis and Visualization: Climate and Environmental Analytics Unit, DatalytIQs Academy (2025)
Leave a Reply
You must be logged in to post a comment.