Heart disease is a multifactorial condition, influenced by physiological, behavioral, and metabolic variables. Understanding how these variables interact helps clinicians and policymakers prioritize preventive measures and refine diagnostic models.
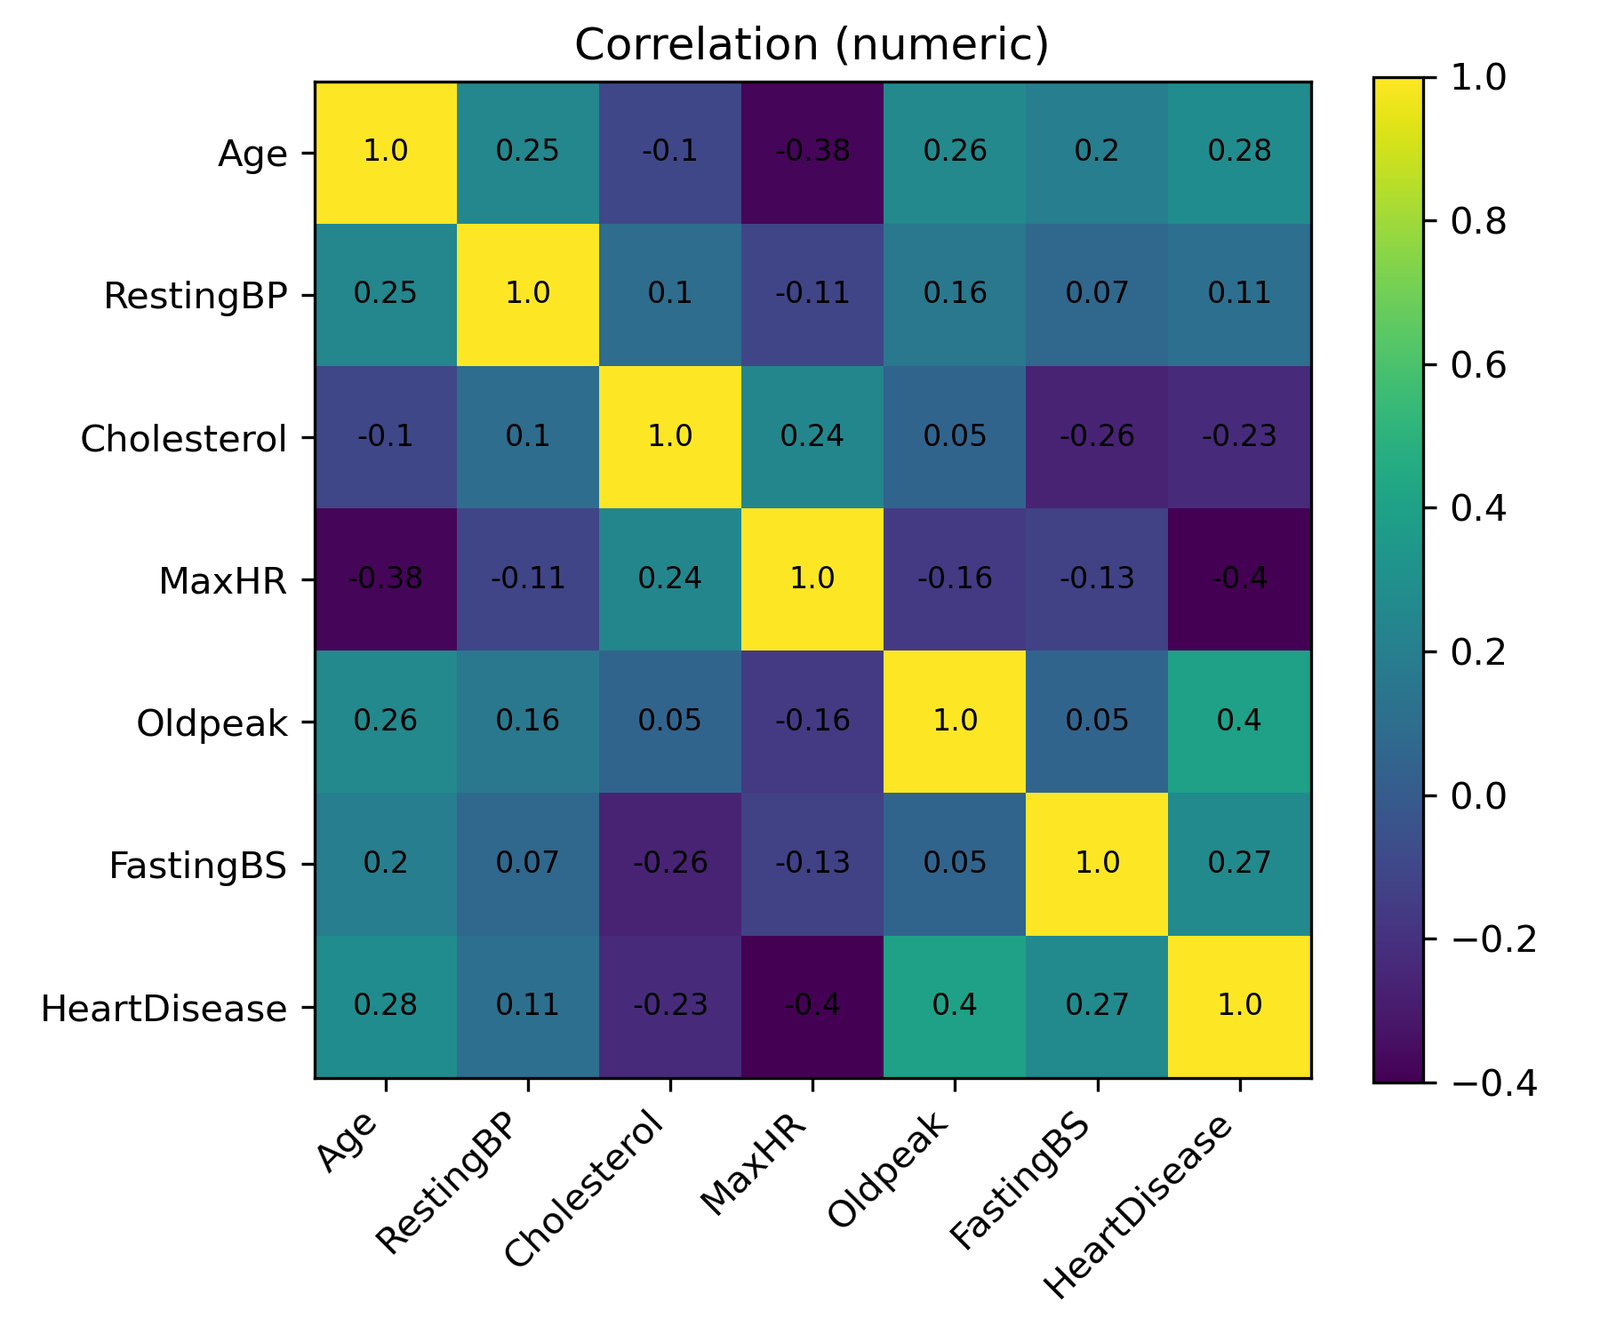
This correlation heatmap provides a quantitative overview of relationships among key variables, including Age, Blood Pressure, Cholesterol, Max Heart Rate (MaxHR), Oldpeak, Fasting Blood Sugar (FastingBS), and Heart Disease.
2. Understanding the Visualization

The heatmap titled “Correlation (numeric)” uses a color-coded scale to represent the strength and direction of linear relationships between numerical variables.
-
Dark purple or blue areas represent negative correlations, where an increase in one variable corresponds to a decrease in another.
-
Yellow areas represent positive correlations, where both variables tend to increase together.
-
Values range from –1 (perfect negative) to +1 (perfect positive) correlation.
3. Key Insights
-
Max Heart Rate (MaxHR) has a strong negative correlation (-0.40) with Heart Disease, implying that patients with lower maximum heart rates are more likely to suffer from cardiac issues, a finding consistent with reduced exercise tolerance in heart patients.
-
Oldpeak (0.40) shows a moderate positive correlation with Heart Disease, reflecting the diagnostic importance of ST depression as a marker for ischemia.
-
Age (0.28) also correlates positively, confirming that heart disease risk increases with age.
-
Fasting Blood Sugar (0.27) shows a weak-to-moderate positive relationship with Heart Disease, aligning with the known comorbidity between diabetes and cardiovascular risk.
-
Cholesterol (-0.23) exhibits a weak negative correlation, suggesting that total cholesterol alone may not always be a strong standalone predictor, highlighting the value of multidimensional modeling.
4. Clinical and Policy Implications
For clinicians:
-
These correlations underscore the value of integrated patient profiling rather than isolated variable assessment.
-
MaxHR and Oldpeak emerge as reliable indicators for risk stratification and stress test evaluation.
For policymakers:
-
Data-driven evidence like this supports targeted national screening programs focusing on high-risk groups, older adults, and individuals with elevated Oldpeak or abnormal heart rate responses.
-
Digital health systems that capture and monitor ECG-derived features could drastically improve early detection and case management.
For data scientists:
-
The modest correlation coefficients suggest that multivariate models (e.g., logistic regression, random forests) are essential for capturing complex nonlinear patterns in heart disease prediction.
5. Analytical Approach
The dataset originates from Kaggle’s open cardiovascular records, analyzed using Python libraries pandas, numpy, and matplotlib.
The correlation coefficients were computed using Pearson’s method, focusing on numeric predictors to assess linear dependencies.
6. Acknowledgement
This work forms part of the DatalytIQs Academy Health Analytics Series, dedicated to transforming open medical data into actionable knowledge for research, education, and policy design.
Author: Collins Odhiambo Owino
Institution: DatalytIQs Academy — Bridging Data, Mathematics, Economics, and Health.
7. Policy Reflection
By visualizing variable relationships, this analysis underscores that no single factor predicts heart disease in isolation.
Effective health policy must integrate data analytics, preventive education, and equitable healthcare access to reduce the global cardiovascular burden.
At DatalytIQs Academy, we continue to advocate for data-driven policy transformation, where every dataset is a tool for better public health.
Leave a Reply
You must be logged in to post a comment.