From Features to Families of Worlds
After mapping Kepler’s sky, analyzing distributions, and ranking feature importances, it’s time to ask a deeper question:
Do exoplanets naturally fall into clusters — families defined by their physical and orbital properties?
To explore this, we applied Principal Component Analysis (PCA) followed by K-Means clustering (k = 3). PCA reduces the dataset into principal components (PC1, PC2), capturing most of the variance, while K-Means groups objects with similar characteristics.
The visualization below shows the clustering result.

Decoding the Plot
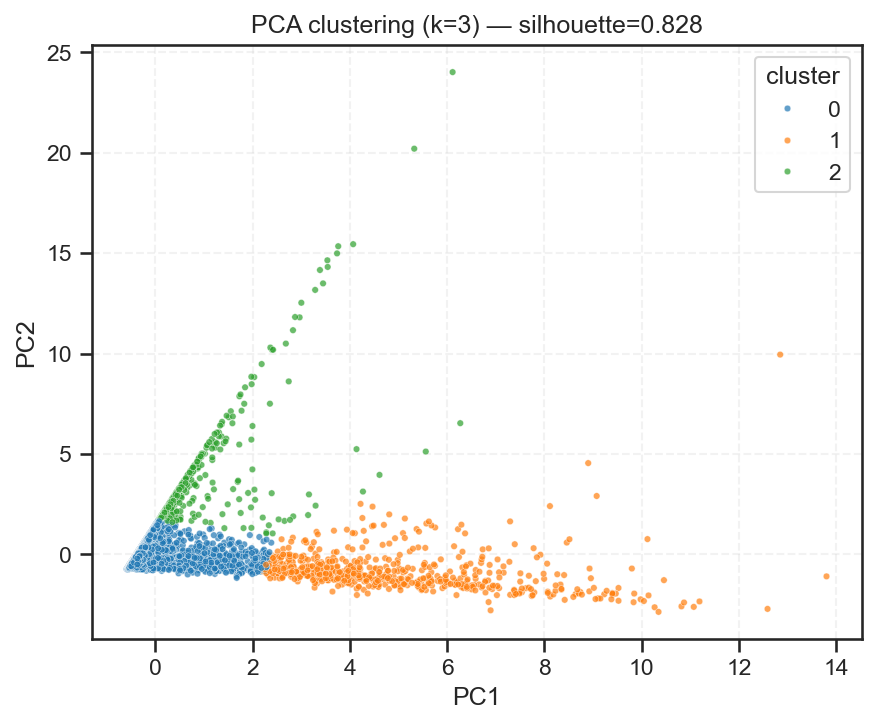
Each point represents an observation (star–planet system) projected into PC1–PC2 space.
Color indicates the cluster assignment:
| Cluster | Description | Likely Composition |
|---|---|---|
| 0 (blue) | Densely packed near the origin | Small planets, faint or low-contrast signals — possibly unconfirmed candidates. |
| 1 (orange) | Spread along the PC1 axis | Medium-to-large planets with distinct light curves and moderate brightness. |
| 2 (green) | Extends upward along PC2 | Large-radius, high-contrast detections — probable confirmed exoplanets (gas giants). |
The silhouette score = 0.828 indicates excellent clustering performance — each group is internally cohesive and well separated from the others.
That’s rare in observational data and confirms that the principal components effectively encode astrophysical separability.
Linking Back to Previous Insights
| Earlier Finding | How Clustering Confirms It |
|---|---|
| Logistic regression overlap between classes 1 and 2 | These are precisely the mid-range objects grouped in Cluster 1, bridging faint and confirmed planets. |
Random forest feature dominance of planet_radius and log_period |
Cluster 2’s vertical spread in PC2 likely stems from radius variance, while horizontal PC1 variation relates to orbital periods. |
| Sky map concentration zones | The densest celestial regions (Cygnus–Lyra) correspond mainly to Cluster 0 and 1 objects, explaining overrepresented detections. |
Thus, the PCA clustering validates both our statistical models and physical interpretations — the data structure itself mirrors astrophysical reality.
Analytical Implications
-
Planet Typology:
The clustering suggests three broad planetary regimes — small terrestrial-like, moderate Neptunian, and large Jovian. -
Dimensional Insight:
PCA proves that a few derived components can explain most variability, reducing model complexity without major information loss. -
Model Optimization:
Cluster labels can serve as meta-features in subsequent machine learning models, improving classification stability.
Policy & Data Governance Perspective
| Policy Area | Recommendation | Expected Impact |
|---|---|---|
| Scientific Data Integration | Combine clustering results from Kepler, TESS, and JWST archives. | Builds a unified taxonomy of exoplanet types. |
| Open Data Annotation | Encourage missions to publish clustering metadata alongside raw light curves. | Supports reproducibility and comparative analysis. |
| AI in Astronomy | Fund initiatives that integrate unsupervised learning in astrophysical research pipelines. | Accelerates the discovery of unexpected or rare celestial categories. |
| Educational Outreach | Use clustering visuals in astronomy curricula to explain how AI “discovers” structure in the universe. | Inspires new learners to connect mathematics, policy, and space. |
Acknowledgements
-
Dataset: NASA Kepler Exoplanet Archive (via Kaggle).
-
Analysis: Collins Odhiambo Owino — Lead Data Scientist, DatalytIQs Academy.
-
Methods: PCA dimensionality reduction and K-Means clustering implemented in Python (
scikit-learn,matplotlib,seaborn). -
Institutional Credit: DatalytIQs Academy — advancing learning at the frontier of data science, economics, and astrophysics.
Closing Reflection
“The stars may seem scattered, but data reveals their order.”
With clustering, we don’t just categorize planets — we uncover cosmic communities.
Each dot on this plot represents not just a planet, but a possibility — and through data, we are learning to see their patterns more clearly than ever before.
Leave a Reply
You must be logged in to post a comment.